. 2007 Oct;5(10):e260.
doi: 10.1371/journal.pbio.0050260.

Brain dynamics underlying the nonlinear threshold for access to consciousness

Affiliations

Brain dynamics underlying the nonlinear threshold for access to consciousness

Antoine Del Cul et al. PLoS Biol. 2007 Oct.

Abstract

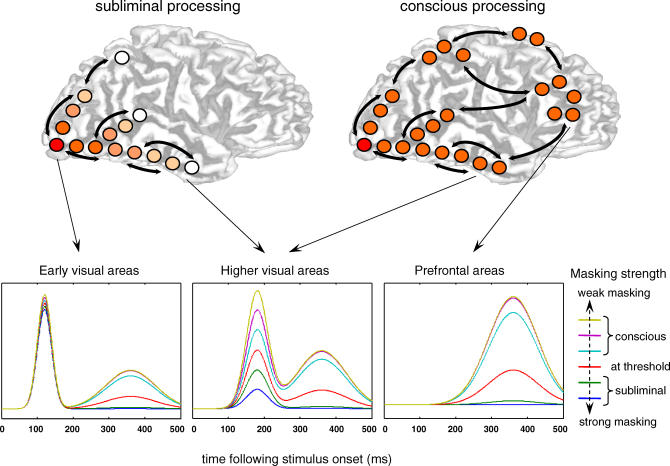
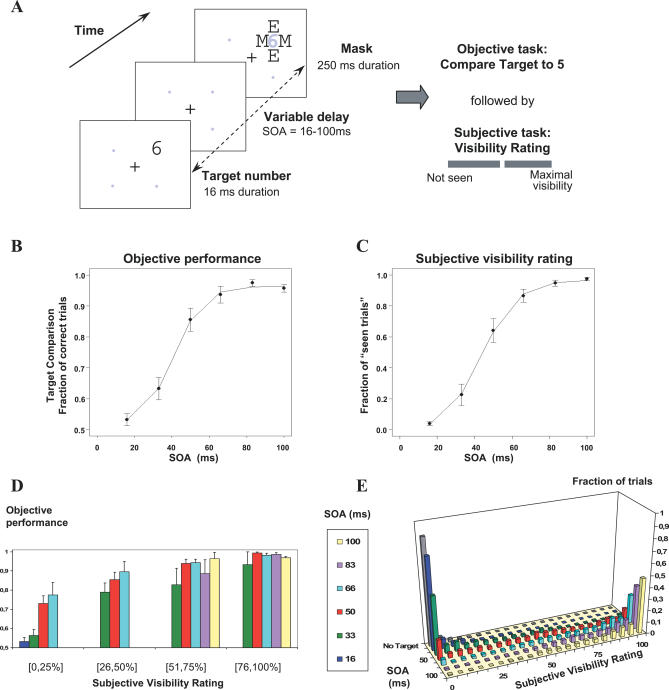
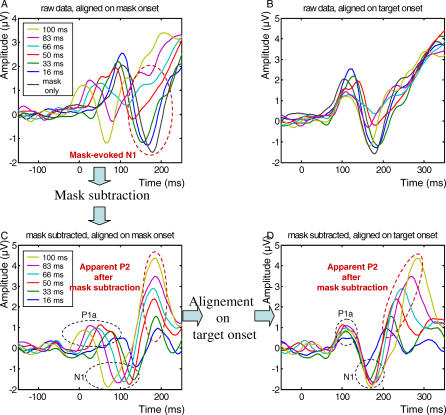
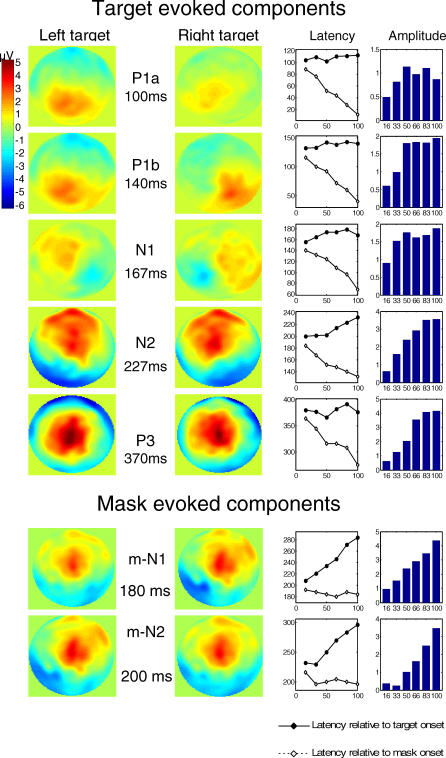
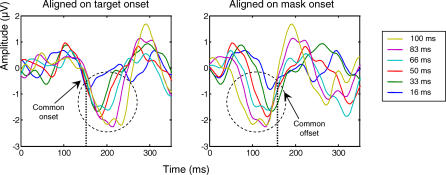
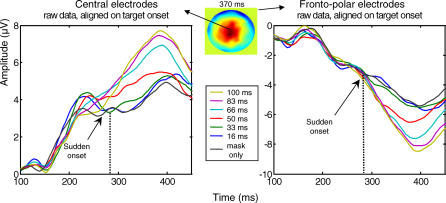
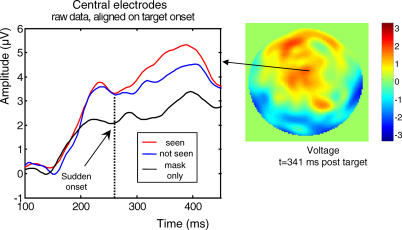
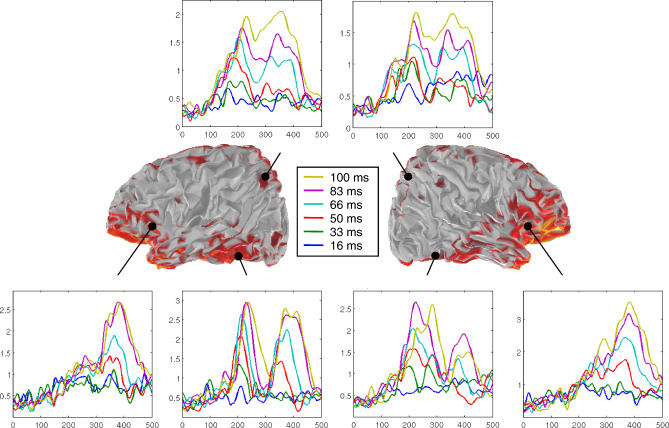
When a flashed stimulus is followed by a backward mask, subjects fail to perceive it unless the target-mask interval exceeds a threshold duration of about 50 ms. Models of conscious access postulate that this threshold is associated with the time needed to establish sustained activity in recurrent cortical loops, but the brain areas involved and their timing remain debated. We used high-density recordings of event-related potentials (ERPs) and cortical source reconstruction to assess the time course of human brain activity evoked by masked stimuli and to determine neural events during which brain activity correlates with conscious reports. Target-mask stimulus onset asynchrony (SOA) was varied in small steps, allowing us to ask which ERP events show the characteristic nonlinear dependence with SOA seen in subjective and objective reports. The results separate distinct stages in mask-target interactions, indicating that a considerable amount of subliminal processing can occur early on in the occipito-temporal pathway (<250 ms) and pointing to a late (>270 ms) and highly distributed fronto-parieto-temporal activation as a correlate of conscious reportability.


Conflict of interest statement

Competing interests. The authors have declared that no competing interests exist.

Figures

Figure 1
Figure 1. Schematic Predictions Concerning the Brain Activation to Subliminal and Supraliminal Masked Stimuli, as Derived from a Global Neuronal Workspace Model of Consciousness
Top, depth of cortical processing: subliminal stimuli (left panel) should evoke a strong activation in extrastriate visual cortex, but their intensity should quickly decrease in higher visual areas; only conscious stimuli (right panel) should trigger a late surge of activation in a global prefronto-parietal network. Bottom, schematic time course of activation as a function of masking strength. Masking is expected to have little effect on early visual activation but to modulate the strength of activation in higher visual areas. Furthermore, there should be a nonlinear effect of masking strength in prefrontal cortex, with a similar late top-down activation peak occurring simultaneously in visual areas [–21].
Figure 2
Figure 2. Experimental Protocol and Behavioral Results Collected during ERP Recording
(A) On each trial, a target numeral (16 ms) was presented at one of four possible location, and followed by a letter mask (250 ms). Gray dots and numerals are shown for spatial reference only, and were not actually presented. Six conditions of target-mask SOA=16, 33, 50, 66, 83, or 100 ms and one mask-only condition (without target) were randomly intermixed across trials. Following each such stimulus, subjects performed two consecutive tasks: (1) forced-choice comparison of the target numeral with the numeral 5 and (2) evaluation of subjective target visibility using a continuous scale labelled “not seen” at left and “maximal visibility” at right. (B and C) Objective and subjective measures of conscious perception. (B) Percentage of correct responses in numerical comparison as a function of SOA. (C) Proportion of trials subjectively rated as “seen” as a function of SOA. In both graphs, the sigmoid curve fitting the data is represented as a continuous line. Error bars represent the standard error. (D) Objective performance at different levels of subjective visibility and SOA; only cells with at least five measures per subject are included. (E) Distribution of subjective visibility ratings yielding the mean data shown in (C).
Figure 3
Figure 3. Mask Subtraction Method
The mask subtraction method is illustrated here for ERP activity recorded in parieto-temporal electrodes controlateral to the hemifield of stimulus presentation (averaged across right and left stimulus presentation). To separate activity evoked by target from activity evoked by the mask, the following procedure was used: (A) Alignment of ERPs on mask onset; (C) Subtraction of ERPs evoked by the mask-only condition from each of the others six target + mask conditions; (D) Realignment of these subtracted ERPs on target onset. For comparison, (B) shows the nonsubtracted ERPs aligned on target onset. The subtraction procedure allowed to recover two target-evoked components (P1a and N1) and one later mask-evoked component (P2).
Figure 4
Figure 4. Sequence of ERP Components Evoked by the Target and Mask
Five ERP components were found to be elicited by the target, and two other components were found to be evoked by the mask. These two last components appeared as positive waveforms since they result from the subtraction of mask-only activity from the mask-evoked N1 and N2 activity for the different target + mask conditions. In the mask-subtracted data, these components appear to increase with SOA, which in reality means that the mask-induced activation (mask-evoked N1 and N2) decreases with SOA. For each component, its peak latency (in milliseconds) is represented as a function of SOA measured relative to target (continuous line) or to mask onset (dashed line). The histograms at right show peak amplitude (in microvolts). Their topography in response to left and right hemifield stimulation is illustrated by voltage maps of the scalp surface, for the target + mask after mask subtraction, SOA=100 ms (first five target-evoked components) and for the mask-only condition (for mask-evoked N1 and N2 components).
Figure 5
Figure 5. Interruption of Target-Evoked Activity by Mask Presentation
Mask-subtracted ERPs from occipito-temporal electrodes, averaged across right and left hemifields of stimulus presentation, are represented aligned respectively on target onset (left panel) and mask onset (right panel). The N2 component shows a common onset for all SOA conditions when ERPs are aligned on target onset, and a common offset when ERPs are aligned on mask onset. Thus, the N2 may reflect a process that starts with target onset and is interrupted by the mask.
Figure 6
Figure 6. Sudden Onset of a Nonlinear Variation of Evoked Activity with SOA
The figure shows the mean amplitude of nonsubtracted ERPs aligned on target onset, measured on central (left panel) and fronto-polar electrodes (right panel). The voltage map shows the topography at the peak of the P3 waveform (latency 370 ms), in the SOA = 100 ms condition. In both graphs, ERPs show a nonlinear increase in amplitude with SOA, with a sudden onset around 270–300 ms.
Figure 7
Figure 7. Difference in Activity Evoked by Conscious and Nonconscious Masked Stimuli
Left panel, mean amplitude of mask-subtracted ERPs measured on central electrodes is represented respectively for seen and not-seen trials, for SOA = 50 ms, for a subset of nine subjects who had enough measures in both conditions. Identical activity is initially observed in both conditions, but a divergence is seen starting around 270 ms, with seen trials generating an increased positivity. This difference is similar to the nonlinear divergence as a function of SOA observed on the same electrodes (see Figure 5). Note that not-seen trials evoked greater activity than mask-only trials, indicating that late subliminal activity was induced by the unseen targets. The right panel shows the topography of the difference between seen and not-seen trials at SOA = 50 ms.
Figure 8
Figure 8. Sequence of Cortical Activity Evoked by the Masked Targets
Left and right views of the partially inflated hemispheres show the reconstructed cortical sources at the peak of the P3 (370 ms) in the condition of maximal visibility (SOA = 100 ms). Colors indicate the activation of reconstructed cortical sources, expressed in current density units (A.m), thresholded at 50% of the maximum (yellow = 10−−7 A.m). Insets show the profiles of mask-subtracted activity (average of absolute current density) in six bilateral regions of interest (right and left posterior parietal, posterior ventral temporal, and inferior frontal areas), separately for the six conditions of SOA. Two phases of cortical activation can be distinguished. In a first phase, prior to about 300 ms, activation progresses from the occipital pole toward both parietal and ventral temporal sites, and its amplitude increases roughly linearly with target-mask SOA. In a second phase, after 300 ms, there is a sudden onset of high-amplitude activity, with a sigmoidal profile, particularly in ventral prefrontal cortex, accompanied by a concomitant reactivation of all previous posterior sites.

References

    1. Breitmeyer B. Visual masking: Time slices through conscious and unconscious vision. New York: Oxford University Press; 2006. 384
    1. Del Cul A, Dehaene S, Leboyer M. Preserved subliminal processing and impaired conscious access in schizophrenia. Arch Gen Psychiatry. 2006;63:1313–1323. - PMC - PubMed
    1. Kiefer M. The N400 is modulated by unconsciously perceived masked words: Further evidence for an automatic spreading activation account of N400 priming effects. Brain Res Cogn Brain Res. 2002;13:27–39. - PubMed
    1. Naccache L, Gaillard R, Adam C, Hasboun D, Clémenceau S, et al. A direct intracranial record of emotions evoked by subliminal words. Proc Natl Acad Sci U S A. 2005;102:7713–7717. - PMC - PubMed
    1. Dehaene S, Naccache L, Le Clec'H G, Koechlin E, Mueller M, et al. Imaging unconscious semantic priming. Nature. 1998;395:597–600. - PubMed

Publication types