. 2007;6(3):8.
doi: 10.1186/jbiol58. Epub 2007 Sep 26.

A global analysis of genetic interactions in Caenorhabditis elegans

Affiliations

A global analysis of genetic interactions in Caenorhabditis elegans

Alexandra B Byrne et al. J Biol. 2007.

Abstract

Background: Understanding gene function and genetic relationships is fundamental to our efforts to better understand biological systems. Previous studies systematically describing genetic interactions on a global scale have either focused on core biological processes in protozoans or surveyed catastrophic interactions in metazoans. Here, we describe a reliable high-throughput approach capable of revealing both weak and strong genetic interactions in the nematode Caenorhabditis elegans.

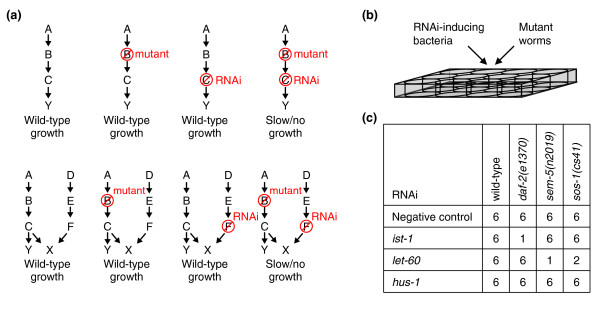
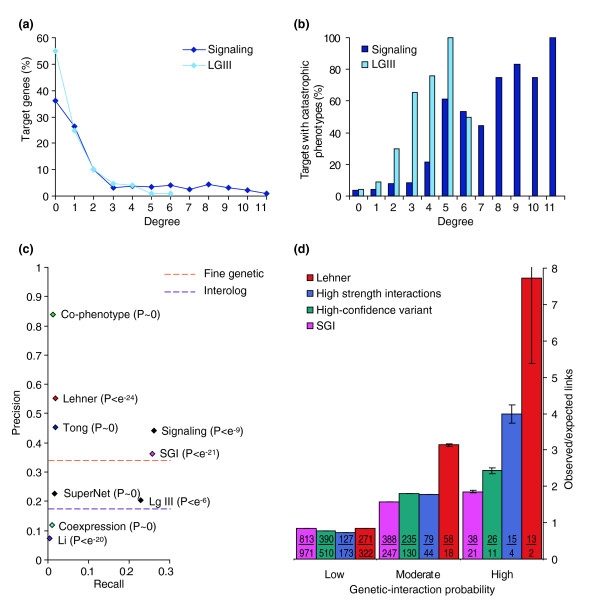
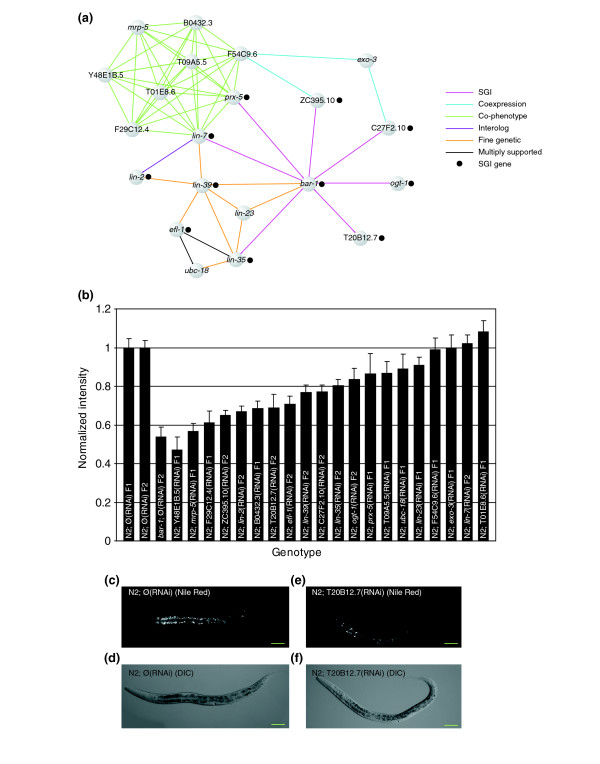
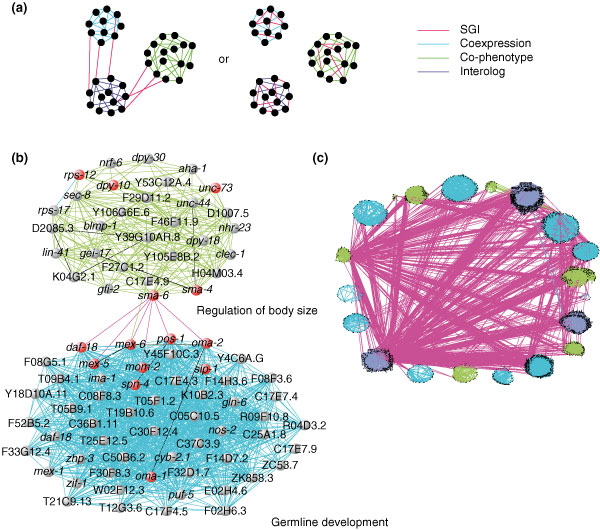
Results: We investigated interactions between 11 'query' mutants in conserved signal transduction pathways and hundreds of 'target' genes compromised by RNA interference (RNAi). Mutant-RNAi combinations that grew more slowly than controls were identified, and genetic interactions inferred through an unbiased global analysis of the interaction matrix. A network of 1,246 interactions was uncovered, establishing the largest metazoan genetic-interaction network to date. We refer to this approach as systematic genetic interaction analysis (SGI). To investigate how genetic interactions connect genes on a global scale, we superimposed the SGI network on existing networks of physical, genetic, phenotypic and coexpression interactions. We identified 56 putative functional modules within the superimposed network, one of which regulates fat accumulation and is coordinated by interactions with bar-1(ga80), which encodes a homolog of beta-catenin. We also discovered that SGI interactions link distinct subnetworks on a global scale. Finally, we showed that the properties of genetic networks are conserved between C. elegans and Saccharomyces cerevisiae, but that the connectivity of interactions within the current networks is not.

Conclusions: Synthetic genetic interactions may reveal redundancy among functional modules on a global scale, which is a previously unappreciated level of organization within metazoan systems. Although the buffering between functional modules may differ between species, studying these differences may provide insight into the evolution of divergent form and function.


Figures

Figure 1
Figure 1
Synthetic genetic-interaction (SGI) analysis in C. elegans. (a) Two scenarios that may result in synthetic interactions are presented. The top row shows how enhancing interactions may arise when hypomorphic loss-of-function worms (mutant), which have reduced but not eliminated function of a gene, are fed RNAi that targets another gene in the same essential pathway. The lower row shows synthetic interactions that may arise when a hypomorph and a gene targeted by RNAi are in parallel pathways that regulate an essential process (X). (b) An outline of the SGI experimental approach. RNAi-inducing bacteria that target a specific C. elegans gene for knockdown (target gene A) are fed to a hypomorphic mutant (query gene B). In parallel, wild-type worms are fed the experimental RNAi-inducing bacteria (control 1), and the query mutant is fed mock RNAi-inducing bacteria (control 2). This is all done in 12-well plate format with at least three technical replicates. Over the course of several days, we estimate the number of progeny produced in each experimental and control well in a blind fashion (see text and Materials and methods). We assigned a growth score from 0–6 (0, 2 parental worms; 1, 1–10 progeny; 2, 11–50 progeny; 3, 51–100 progeny; 4, 101–200 progeny; 5, 200+ progeny; and 6, overgrown). (c) Interacting gene pairs are inferred through a difference in the population growth scores between experimental and control wells. In the example shown, a global analysis of the experimental and control query-target combinations revealed that daf-2 interacts with ist-1, and that sem-5 and sos-1 both interact with let-60.
Figure 2
Figure 2
The SGI network. (a) The precision and recall of the 51 unique network variants, as calculated with respect to GO Biological Process annotation (see Materials and methods). The high-confidence variant is highlighted in pink and the SGI variant in teal. (b) The SGI network contains 1,246 unique synthetic genetic interactions, of which 833 (67%) are between a query gene and a gene in the signaling set, and 413 (33%) are between a query gene and a gene in the LGIII set. Visualization generated with Cytoscape [85]. (c) The percentage of target interactions per query gene in both the signaling (dark-blue) and the LGIII (light-blue) networks. The raw number of interacting target genes in each experiment (signaling, LGIII) is shown below each bar. The error bars represent one standard deviation assuming a binomial distribution.
Figure 3
Figure 3
Global patterns of interactions within the SGI network. (a) Two-dimensional clustergram of SGI interactions based on average strength of interaction. RNAi-targeted genes are represented along the rows and the 11 query hypomorphs across the columns. The shades from black to yellow on the bottom scale indicate increasing interaction strength, and shades from black to light-blue indicate increasing alleviating interaction strength. Alleviating interaction strengths indicate that the double reduction-of-function worms grow better than controls. (b) The query network. Query genes (nodes) are linked in this network if they share a significant number of interaction partners or if there is evidence of a functional interaction (see text). Edges are colored according to the type of supporting evidence (see text and Materials and methods for more details). Visualization generated with Cytoscape [85].
Figure 4
Figure 4
Network properties of SGI and other published datasets. (a) A plot of the percentage of targets (y-axis) that interact with a given number of query genes (x-axis), illustrating that the SGI network has properties similar to that of scale-free networks. (b) A plot of the percentage of targets that yield a catastrophic phenotype when targeted by RNAi in a wild-type background [3] (y-axis) as a function of how many query genes they interact with (degree, x-axis). (c) The precision and recall of interaction networks calculated with respect to GoProcess1000 (see Materials and methods). Significance values (in brackets) were calculated using the hypergeometric distribution. The source of the networks is presented in the text, except for the SuperNet (superimposed network, see Materials and methods). The orange dashed line indicates the precision of the fine genetic interactions extracted from WormBase. The lower dashed line indicates the precision of the interolog network (see Materials and methods). The recall of these two datasets cannot be calculated, as the number of genes that were tested cannot be ascertained. (d) An independent test of the likelihood of true interactions among the Lehner [24] and SGI genetic-interaction datasets using the algorithm of Zhong and Sternberg [44], which predicts a confidence level for a genetic interaction between any given gene pair in C. elegans. The 656 interactions of the 'high-confidence' SGI variant, along with the 229 interactions of the highest interaction strength within the SGI network are also analyzed. Each experimentally derived interacting gene pair is binned according to the confidence level predicted by Zhong and Sternberg (x-axis): low-, moderate- and high-confidence predictions have interaction probabilities of 0–0.6, 0.6–0.9, and 0.9–1.0, respectively. The results are plotted as a ratio of the number of experimentally identified interacting gene pairs to the number of gene pairs expected to be in that bin by chance (y-axis). Expected counts were determined by assuming a uniform distribution across all bins for all tested gene pairs. Values within each bar show the number of observed gene pairs over the number expected by chance. The key indicates the data source. Error bars indicate one standard error of the mean.
Figure 5
Figure 5
An analysis of the overlap between genetic interactions and other modes of interaction. The number of genetically interacting gene pairs from SGI, Lehner [24], the transposed SGA dataset [12] and low-throughput 'fine genetic interactions' [43] (see text and Materials and methods) that also interacted through direct protein-protein interactions (PPI) [37], or were tightly coexpressed (coexpression) [38,40], or had similar phenotypic profiles (co-phenotype) [3,4,42] (see Materials and methods) was analyzed (x-axis). Only gene pairs tested in both relevant datasets are considered here. To account for the differences and disparity of genes tested in the various screens, the results are represented as the number of interactions that overlap between the two datasets as a function of the number of identical or homologous gene pairs tested in both studies (y-axis). Error bars indicate one unit of standard deviation assuming a binomial distribution.
Figure 6
Figure 6
A schematic diagram of the construction of a superimposed network. Networks collected or constructed from various data sources were combined to create the superimposed network. Nodes represent genes; edges are colored according to the data type they represent.
Figure 7
Figure 7
The bar-1 module regulates fat storage and/or metabolism. (a) The 'bar-1 module' of 21 genes was identified by virtue of the interconnectedness of coexpression, co-phenotype, genetic, and protein interactions within the superimposed network. Edges are colored according to the type of supporting evidence. Genes tested for interaction with bar-1 within the original SGI matrix are indicated (black dot). Visualization generated with Visant [86]. (b) Fat accumulation and/or storage disruption in the bar-1 module. Genes in the bar-1 module were targeted by RNAi in an N2 background. The resulting worms were stained with Nile Red and staining was quantified in order to compare values to N2 worms fed negative control RNAi (see Materials and methods). Fifteen of 20 genes show a reduction of Nile Red staining in an N2 background. Values have been normalized with N2 values for each experiment. Error bars represent standard error of the mean. (c,e) Dark-field micrographs of Nile Red staining (shows as bright patches) in N2 worms fed either (c) negative control mock-RNAi (∅ RNAi) or (e) RNAi that targets T20B12.7. (d,f) The corresponding differential interference contrast micrographs are shown below the dark-field micrographs. Scale bar, 50 μm.
Figure 8
Figure 8
SGI interactions bridge subnetworks. (a) Three hypothetical subnetworks are depicted. We asked whether SGI interactions are more likely to bridge subnetworks (left) or fall within subnetworks (right). (b) An example of a bridged subnetwork pair is shown. A 'regulation of body size' co-phenotype subnetwork (green links) is linked to a 'formation of primary germline' coexpression subnetwork (blue links) via six SGI interactions (pink links). Visualization generated with Visant [86]. (c) Broad subnetworks were identified separately within the coexpression (blue), co-phenotype (green), and interolog (purple) networks (see Materials and methods). All broad subnetworks that are significantly bridged with at least one other broad subnetwork by SGI interactions (pink edges) are shown. Nodes (black dots) represent individual genes. Visualization generated with Visant [86].
Figure 9
Figure 9
A schematic diagram showing the approaches used to investigate whether synthetic genetic network connectivity is conserved. In all panels, nodes represent genes and lines represent interactions. (a) Among pairs of homologous genes tested for interaction in both worm and yeast, we investigated whether there was significant overlap between worm (pink) and yeast (blue) genetic interactions (left), or few overlapping interactions (right). (b) After identifying subnetworks (groups of highly interconnected nodes linked by green, purple or light-blue links) within the superimposed network, we investigated whether worm (pink) and yeast (blue) genetic interactions link the same (left) or different (right) subnetworks.

References

    1. Giaever G, Chu AM, Ni L, Connelly C, Riles L, Veronneau S, Dow S, Lucau-Danila A, Anderson K, Andre B, et al. Functional profiling of the Saccharomyces cerevisiae genome. Nature. 2002;418:387–391. doi: 10.1038/nature00935. - DOI - PubMed
    1. Hodgkin J. What does a worm want with 20,000 genes? Genome Biol. 2001;2:comment2008.1–2008.4. doi: 10.1186/gb-2001-2-11-comment2008. - DOI - PMC - PubMed
    1. Kamath RS, Fraser AG, Dong Y, Poulin G, Durbin R, Gotta M, Kanapin A, Le Bot N, Moreno S, Sohrmann M, et al. Systematic functional analysis of the Caenorhabditis elegans genome using RNAi. Nature. 2003;421:231–237. doi: 10.1038/nature01278. - DOI - PubMed
    1. Simmer F, Moorman C, van der Linden AM, Kuijk E, van den Berghe PV, Kamath RS, Fraser AG, Ahringer J, Plasterk RH. Genome-wide RNAi of C. elegans using the hypersensitive rrf-3 strain reveals novel gene functions. PLoS Biol. 2003;1:e12. doi: 10.1371/journal.pbio.0000012. - DOI - PMC - PubMed
    1. Guarente L. Synthetic enhancement in gene interaction: a genetic tool come of age. Trends Genet. 1993;9:362–366. doi: 10.1016/0168-9525(93)90042-G. - DOI - PubMed

Publication types

MeSH terms

Substances

LinkOut - more resources