. 2007 Sep 26;27(39):10383-90.
doi: 10.1523/JNEUROSCI.2963-07.2007.

Attention improves population-level frequency tuning in human auditory cortex

Affiliations

Attention improves population-level frequency tuning in human auditory cortex

Hidehiko Okamoto et al. J Neurosci. .

Abstract

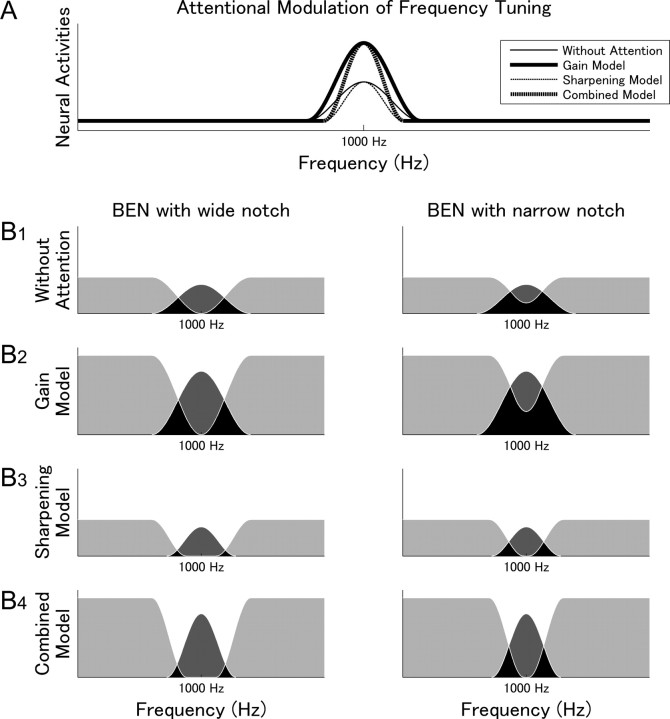
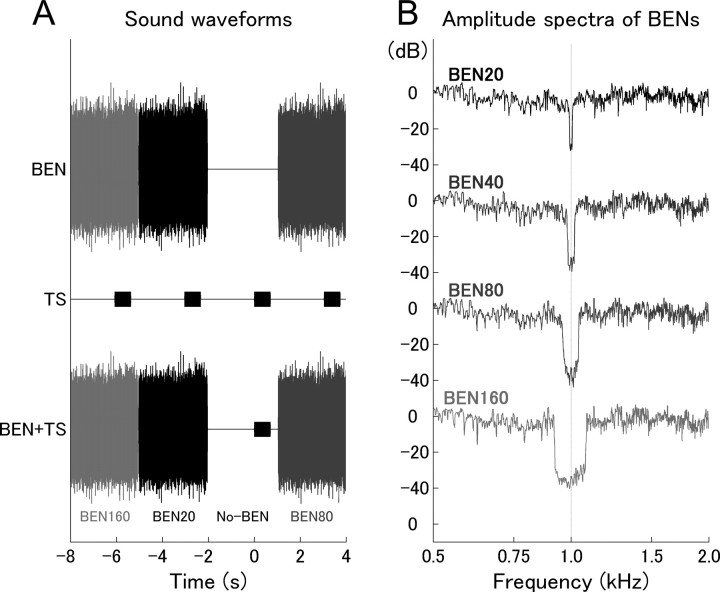
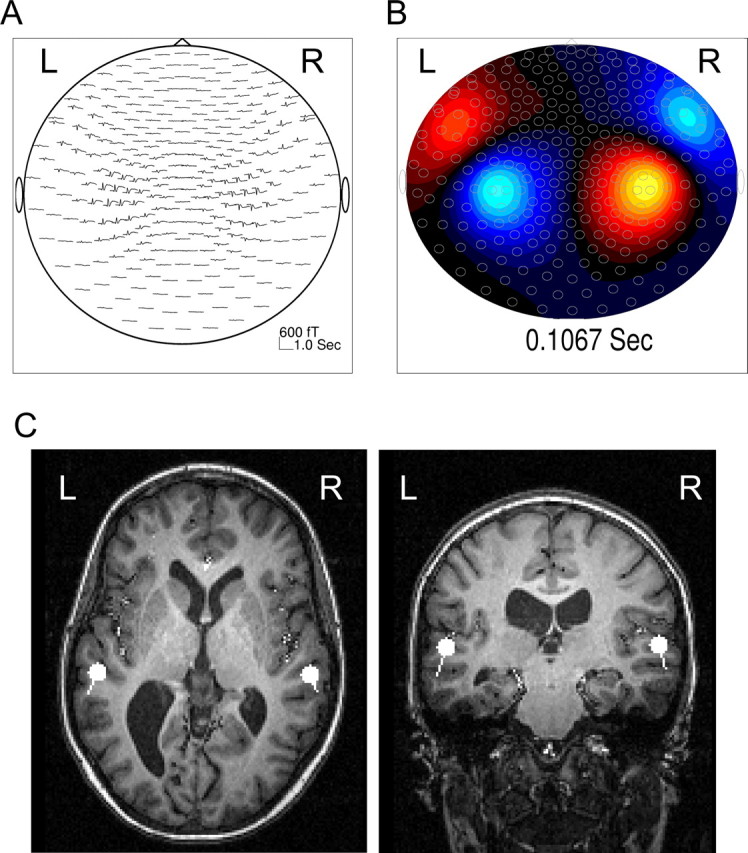
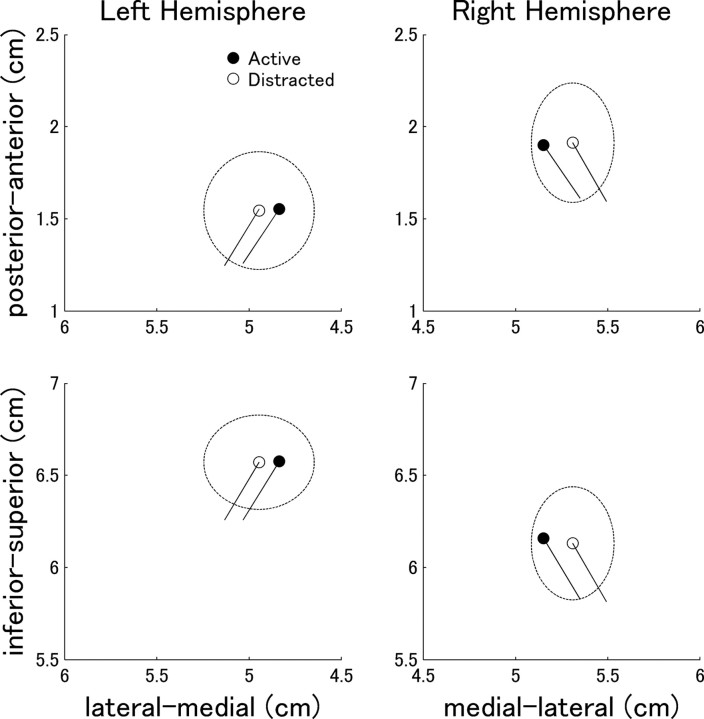
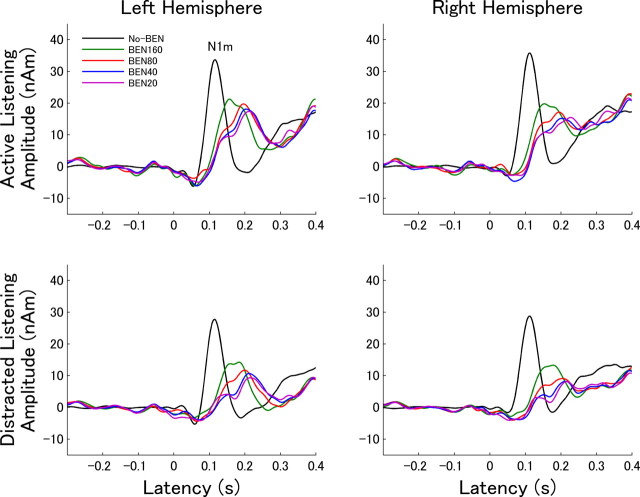
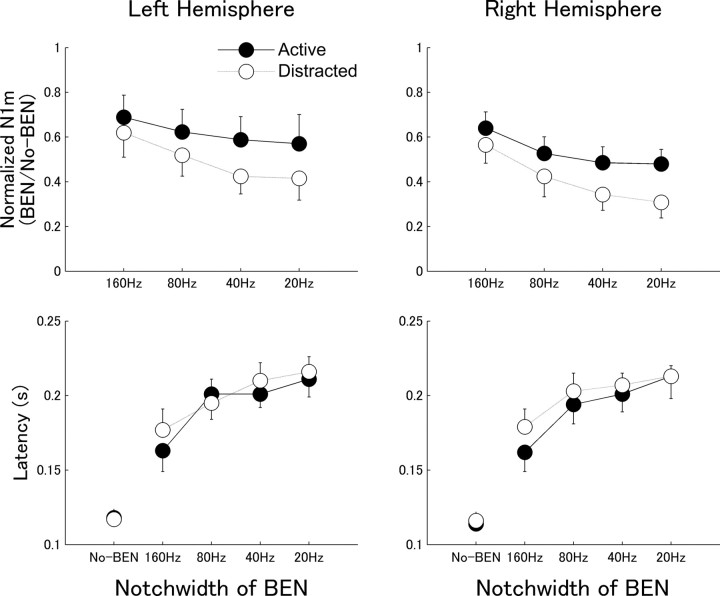
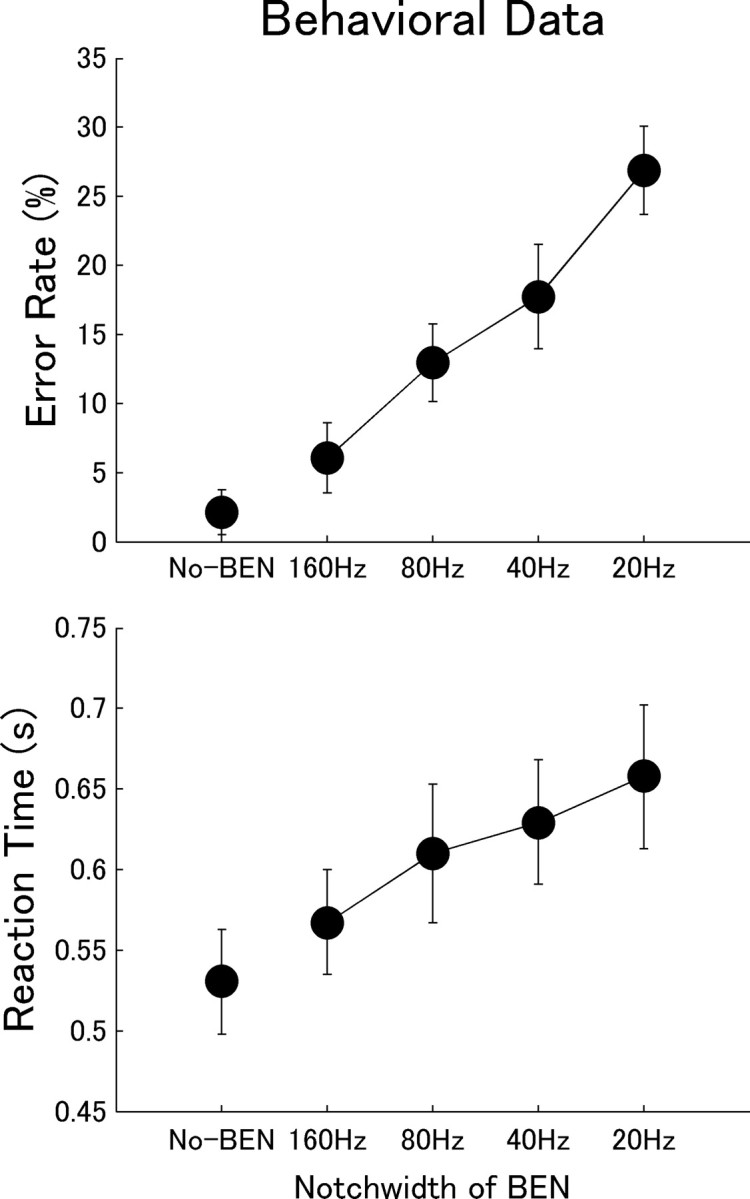
Attention improves auditory performance in noisy environments by either enhancing the processing of task-relevant stimuli ("gain"), suppressing task-irrelevant information ("sharpening"), or both. In the present study, we investigated the effect of focused auditory attention on the population-level frequency tuning in human auditory cortex by means of magnetoencephalography. Using complex stimuli consisting of a test tone superimposed on different band-eliminated noises during active listening or distracted listening conditions, we observed that focused auditory attention caused not only gain, but also sharpening of frequency tuning in human auditory cortex as reflected by the N1m auditory evoked response. This combination of gain and sharpening in the auditory cortex may contribute to better auditory performance during focused auditory attention.


Figures

Figure 1.
Figure 1.
Attentional modulation of frequency tuning. A, The figure illustrates how different effects of attention [gain model vs sharpening model vs combined (gain plus sharpening) model] would modulate population-level neural activities corresponding to the 1000 Hz test stimulus. Gain is reflected by increased amplitudes, sharpening is reflected by narrow frequency distributions. B1–B4, The figures illustrate the relationship of neural activities elicited by BEN and TS as predicted by the different attention models. Light gray areas represent neural activities exclusively elicited by BEN, and dark gray areas represent neural activities exclusively elicited by TS. Black areas indicate overlap: neurons in these areas could be activated by both BEN and TS but in fact had already been activated by BEN when TS appeared. Dark gray areas represent N1m source strength reflecting TS onset. B1 displays neural activities evoked without focused auditory attention (i.e., broad frequency tuning and weak neural activities as indicated by rather wide frequency distributions and rather small amplitudes). B2 illustrates the gain model (i.e., broad frequency tuning and strong neural activities as indicated by rather wide frequency distributions and rather large amplitudes). B3 illustrates the sharpening model (i.e., sharp frequency tuning and weak neural activities as indicated by rather narrow frequency distributions and rather small amplitudes). B4 displays the combined (gain plus sharpening) model (i.e., sharp frequency tuning and strong neural activities as indicated by rather narrow frequency distributions and rather large amplitudes). Left diagrams illustrate BENs with broad spectral notch; right diagrams illustrate BENs with narrow spectral notch. Of note, the neural activities in both gain and combined models are enhanced because of the gain effect of attention. In addition, size ratios of dark gray areas between narrow BEN and wide BEN differ between models: for B3 and B4, ratios are much closer to 1 compared with B1 and B2, reflecting the sharpening effect of attention on population-level frequency tuning.
Figure 2.
Figure 2.
Experimental design. A, Schematic representation of the stimulation sequence. BENs of 3 s duration and the TS of 700 ms duration are displayed individually in the top and middle rows, respectively. The combined stimulation sequence (BEN+TS) is displayed in the bottom row. Note that the TS waveform is not clearly visible in the combined waveform in the bottom row because of its 15 dB lower amplitude compared with BEN power. B, Amplitude spectra of the 3 s BENs measured at the earpiece. The eliminated bandwidths are 20 Hz (BEN20), 40 Hz (BEN40), 80 Hz (BEN80), and 160 Hz (BEN160). The center frequency of the eliminated region was always 1000 Hz, which corresponded to the carrier frequency of the TS.
Figure 3.
Figure 3.
Representative single-subject result. A, Auditory evoked magnetic fields obtained in the no-BEN condition. Thirty hertz low-pass-filtered MEG waveforms are displayed in a flattened sensor position projection. B, Isocontour maps of the magnetic fields corresponding to the maximal N1m response showing dipolar patterns above both hemispheres at a latency of 0.1067 s. Red areas represent inward flows of magnetic fields from the brain, whereas blue areas represent outward flows. C, Calculated dipole locations and orientations overlaid on an individual MRI.
Figure 4.
Figure 4.
Estimated source locations of N1m. Localization of the N1m sources in the y–x plane (medial–lateral vs posterior–anterior directions) and the y–z plane (medial–lateral vs inferior–superior directions). Filled symbols represent active listening; open symbols represent distracted listening. The ellipses around the open symbols denote the 95% confidence interval limits of the differences between active and distracted listening.
Figure 5.
Figure 5.
Grand-averaged source strength waveforms. The top graph displays grand-averaged (n = 13) source waveforms for the N1m for all BEN conditions during active listening. The bottom graph displays waveforms during distracted listening.
Figure 6.
Figure 6.
Normalized N1m source strengths and latencies. The graphs display the group means (n = 13) of the normalized N1m source strengths (top graphs) and latencies (bottom graphs) for each BEN condition with error bars denoting the 95% confidence intervals for the group means. Filled circles denote the responses during active listening, and open circles denote the responses during distracted listening.
Figure 7.
Figure 7.
Behavioral measurement: error rate and reaction time. The diagrams display the error rate (top diagram) and reaction time (bottom diagram) as a function of BEN type, with error bars denoting the 95% confidence interval limits of the group (n = 13) means.

Similar articles

Cited by

References

    1. Alain C, Arnott SR. Selectively attending to auditory objects. Front Biosci. 2000;5:D202–D212. - PubMed
    1. Barbour DL, Wang X. Temporal coherence sensitivity in auditory cortex. J Neurophysiol. 2002;88:2684–2699. - PubMed
    1. Benedict RH, Lockwood AH, Shucard JL, Shucard DW, Wack D, Murphy BW. Functional neuroimaging of attention in the auditory modality. NeuroReport. 1998;9:121–126. - PubMed
    1. Boemio A, Fromm S, Braun A, Poeppel D. Hierarchical and asymmetric temporal sensitivity in human auditory cortices. Nat Neurosci. 2005;8:389–395. - PubMed
    1. Diamond DM, Weinberger NM. Physiological plasticity of single neurons in auditory cortex of the cat during acquisition of the pupillary conditioned response: II. Secondary field (AII) Behav Neurosci. 1984;98:189–210. - PubMed

Publication types