. 2007 Sep 26;27(39):10556-67.
doi: 10.1523/JNEUROSCI.1631-07.2007.

Rapid homeostatic plasticity in the intact adult visual system

Affiliations

Rapid homeostatic plasticity in the intact adult visual system

Kenneth C Riegle et al. J Neurosci. .

Abstract

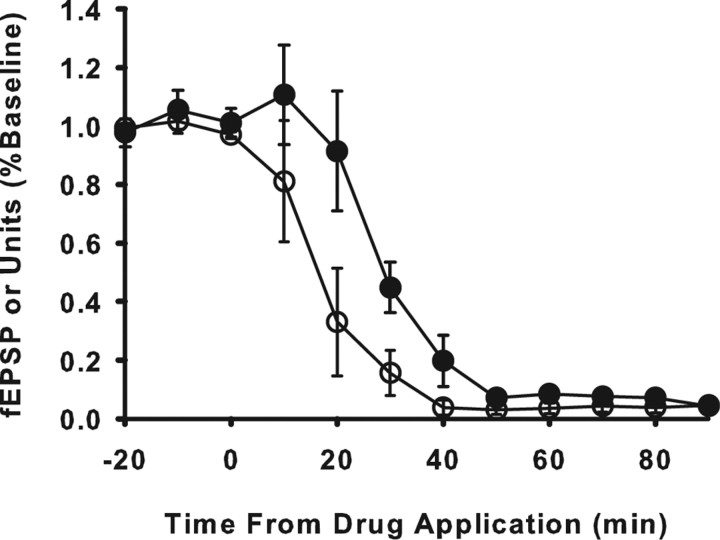
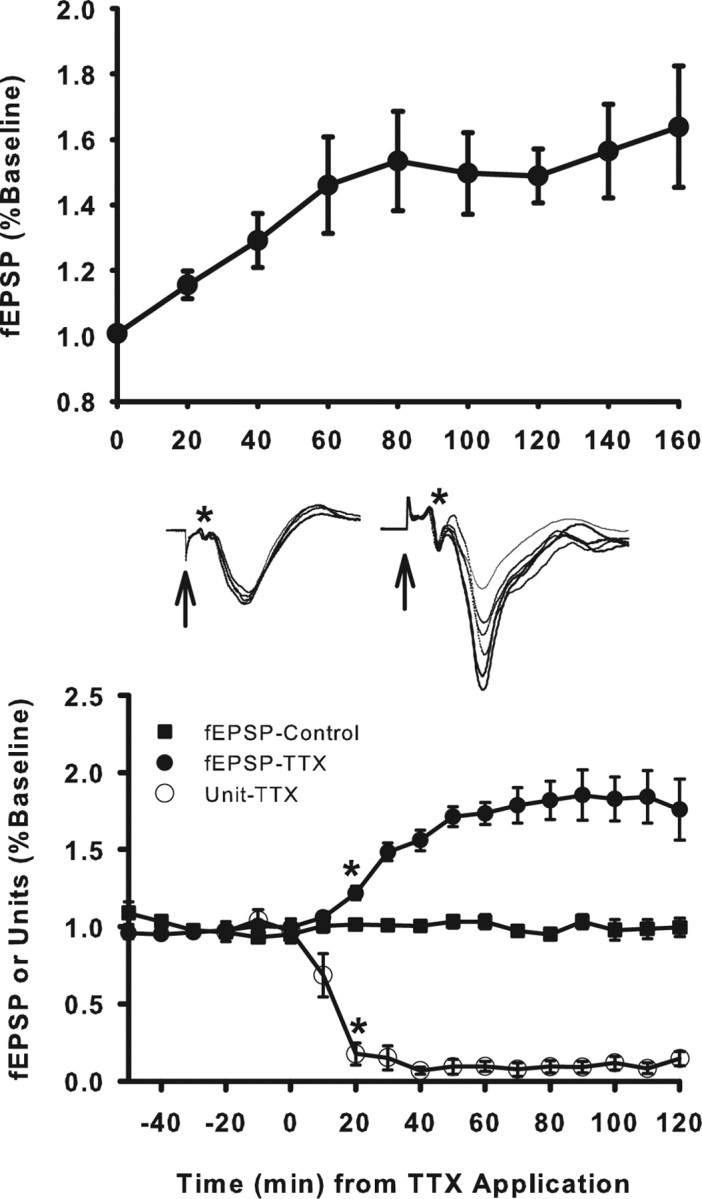
Neurons may possess activity-dependent homeostatic mechanisms that permit them to globally alter synaptic strength as activity varies. We used the retinotectal projection of goldfish to test this idea in the intact adult CNS. We first altered tectal neuron activity by selectively manipulating excitatory input. When excitatory synaptic drive to tectal neurons was eliminated by blocking optic fibers, current evoked at optic synapses increased by 183% within 90 min. With partial activity blockade, the increase in synaptic strength scaled with the magnitude of activity depression. This silence-induced potentiation was also rapidly reversible. Conversely, an increase in optic input was followed by a decrease in evoked synaptic current. When optic drive was not altered and tectal neuronal activity was instead increased or decreased pharmacologically via GABA(A) receptors, synaptic strength again changed inversely with activity, indicating that synaptic strength changed in response to neuronal activity and not excitatory drive. Furthermore, altered synaptic strength tended to return ongoing activity to baseline. Changes in synaptic strength could also be detected in heterosynaptic pathways, indicating a global response. Finally, changes in synaptic strength were associated with corresponding changes in ongoing and evoked firing rates, indicating that the responsivity of tectal neurons was altered. Thus, tectal neurons exhibit archetypical homeostasis, one of the first robust examples in the intact adult CNS.


Figures

Figure 1.
Figure 1.
Time-dependent changes in ongoing tectal unit activity after nerve crush or TTX eye injection. Top, Intrinsic tectal activity increased significantly after elimination of spontaneous optic input to tectum by optic nerve crush (*p < 0.001). Bottom, Intrinsic tectal activity also increased significantly after elimination of spontaneous optic input to tectum by intraocular TTX injection (**p < 0.001). Time 0 represents baseline activity for 30 min before TTX; other bars represent activity 30–120 min after TTX. Data points are average spike rates for 10 min bins that ended at time indicated on x-axis; error bars are SEM.
Figure 2.
Figure 2.
Temporal changes in ongoing unit activity and fEPSP after tectal superfusion of a glutamate–glycine receptor antagonist mixture. Blocking synaptic transmission eliminates the fEPSP generated by stimulation of the optic nerve (filled circles). Tectal units coincidentally decline by >95% (open circles), although presynaptic activity in the optic nerve was still present.
Figure 3.
Figure 3.
Diagram of retinotectal circuitry. Top, Type XIV pyramidal neurons have a soma in the periventricular layer (SPV) of tectum and extend an apical dendrite into the primary optic layer of tectum (SFGS) in which it branches profusely. Optic fibers, which form 40% of the synapses in SFGS, terminate primarily onto these apical dendrites. Bottom, fEPSP. Stimulation of the optic nerve generates a current sink in the SFGS and a source in SPV. Electrodes placed in the SFGS record a field EPSP reflecting current at optic synapses. The stimulus artifact (arrow) and presynaptic fiber volley (*) are identified. SO, Stratum opticum; SGC, stratum griseum centrale; SAC, stratum album centrale; SPV, stratum periventriculare.
Figure 4.
Figure 4.
Elimination of optic drive to tectum induces rapid enhancement of current at optic synapses. Top, Changes in fEPSPs evoked in tectum by optic nerve stimulation after optic nerve crush. The fEPSP increased significantly by 20 min (**p < 0.001) and progressively increased, reaching a plateau at ∼60–80 min. Bottom, Changes in fEPSP after intraocular injection of TTX. TTX eliminated optic input to tectum, causing unit activity in tectum to rapidly decline by >90% (open circles). The evoked fEPSPs (filled circles and sample waveform traces at right) increased significantly above baseline by 20 min (*p < 0.001) and reached a plateau at ∼60–80 min. Evoked fEPSPs in contralateral control tecta remained unchanged (filled squares and fEPSP traces at left). Evoked fEPSP magnitudes were calculated as the average of five fEPSPs evoked during each 10 min bin and expressed as a percentage of the average fEPSP for the first 10 min bin of the recording session (nerve crush) or baseline period before injection (time −50 to 0). Each plotted data point is an average for all animals and represents the fEPSP magnitude for the 10 min bin that ended at the time the point is plotted. Error bars indicate SEM. Arrows and asterisks on fEPSP traces represent stimulus artifact and presynaptic fiber volley, respectively.
Figure 5.
Figure 5.
Silenced-induced potentiation occurs in the absence of continuous nerve stimulation. fEPSPs were evoked by optic nerve shock and recorded from SFGS of tectum every 2 min during a 30 min baseline period. At time 0, TTX was injected into one eye, and the protocol for evoking fEPSPs was suspended. The stimulus protocol was resumed at time 60. The first fEPSPs evoked in the silenced pathway (60–70 min bin; filled circles) exhibited a significant potentiation (*p < 0.00001), whereas fEPSPs from contralateral control tecta (open circles) were unaffected. fEPSP magnitudes were calculated and expressed as in TTX experiment of Figure 4. Error bars indicate SEM.
Figure 6.
Figure 6.
Enhancement is restricted to locally silenced regions of tectum. Partial nerve crush was used to silence local regions of tectum, and fEPSPs were evoked continuously for 120 min (left and middle sets of bars). Evoked fEPSPs increased significantly (*p < 0.04) in silenced tectal regions (Denervated) at 60 and 120 min after crush compared with fEPSPs recorded immediately after crush (time 0). Evoked fEPSPs in adjacent active regions (Innervated) of the same tectum showed no change. In another set of experiments, small scotomas were created in retina to silence very small regions of tectum. After 60 min, fEPSPs were sampled in silenced regions and expressed as a percentage of the fEPSP recorded in adjacent active regions of the same tectum. This fEPSP (Scotoma) was significantly larger (*p < 0.01). Error bars represent SEM.
Figure 7.
Figure 7.
Potentiation of fEPSP scales with degree of retinal activity blockade. Different concentrations of intraocular TTX were used to differentially reduce activity in one retina (circles, 0.3 mm TTX; triangles, 0.45 mm TTX; squares, 1.2 mm TTX). Changes in tectal unit activity (open symbols) and in the fEPSP (filled symbols) were monitored. The fEPSP increased significantly (p < 0.01) by 60 min for all concentrations, but the increase was proportional to the reduction in activity. No such changes were observed in contralateral control tecta (dashed line with open octagons). Units and fEPSPs calculated as in Figure 4. Error bars indicate SEM.
Figure 8.
Figure 8.
Activity-induced potentiation of fEPSP is rapidly reversible. The fEPSP in control tecta (white bars) as well as tectal activity (gray bars) and fEPSPs (black bars) in the contralateral experimental tecta were recorded. After a 30 min baseline (bars denoted as time 0), the short-acting anesthetic marcaine sulfate (3.0 μl of 200 mm) was injected into one eye (experimental). At 60 min (bars denoted 60), tectal activity declined significantly (*p < 0.001), whereas the fEPSP potentiated significantly (*p < 0.001). As the effect of marcaine sulfate diminished during the subsequent 2 h (bars denoted 180), tectal activity primarily recovered and the fEPSP returned to baseline. Control pathway fEPSPs (white bars) and tectal activity (data not shown) did not change significantly over the course of the experiment. Tectal activity and fEPSPs were recorded and expressed as described in Figure 4. Error bars are SEM.
Figure 9.
Figure 9.
Increased optic drive decreases optic synaptic gain. After a baseline recording period of ongoing tectal unit activity and fEPSP, continuous stroboscopic illumination at 2 Hz was commenced at time 0. Tectal activity (open symbols) increased substantially and was associated with a significant (*p < 0.001) depression of evoked fEPSPs (filled symbols). Unit activity and fEPSPs were calculated and presented as described in Figure 4. Error bars are indicate SEM.
Figure 10.
Figure 10.
Pharmacologically induced changes in tectal activity alter optic synaptic gain. Superfusion of GABAA agonist (P4S) onto tectum for 60 min depressed activity (black bar, P4S-60) relative to baseline (black bar, P4S-0). Concurrently, the evoked fEPSPs (white bar, P4S-60) was significantly enhanced (**p < 0.001) compared with baseline fEPSP (white bar, P4S-0). Conversely, superfusion of GABAA antagonist (BH) for 60 min increased tectal activity (black bar, BH-60) relative to baseline (black bar, BH-0), resulting in a significant depression of evoked fEPSPs (white bar, BH-60; *p < 0.002) compared with baseline (white bar, BH-0). Bars for P4S-0 and BH-0 represent mean values for the 30 min baseline period; bars for P4S-60 and BH-60 represent 10 min bins ending at 60 min after superfusion began. Error bars are SEM.
Figure 11.
Figure 11.
Potentiation at optic synapses is associated with greater evoked unit activity in tectum. Top, Activity histogram of evoked units generated by weak stimulation of the optic nerve immediately (0 min, white bars), 60 min (gray bars), and 120 min (black bars) after intraocular TTX injection. The 0 min recordings were meant as a control for the acute effects of the TTX injection because the potentiation developed relatively slowly compared with the effect of TTX on retinal activity. In this example from a single animal, greater evoked unit activity is seen at most poststimulus times at the 60 and 120 min after TTX. Activity was expressed as spikes per second. Bottom, Same experiment as above, but data were pooled from all animals for the 6–10 and 14–20 ms time bins for averaging and statistical testing. The number of spikes evoked at 6–10 ms were significantly greater at both 60 min (gray bar; *p < 0.02) and 120 min (black bar; *p < 0.01) relative to units evoked immediately after injection (white bar). The increase in units evoked from downstream neurons at 14–20 ms did not reach significance. Pre-Stim bars represent intrinsic tectal activity before the stimulus.
Figure 12.
Figure 12.
Activity-induced depression of synaptic efficacy returns activity to baseline. After a 20 min baseline recording period, 25 μm β-hydrastine was continuously superfused over tectum for 2 h. The GABAA antagonist slowly increased tectal activity (open circles) to 162 ± 5.7% of baseline 60 min after initiation of superfusion. The increase in tectal activity was associated with a significant (*p < 0.01, t test) depression of the fEPSP (filled circles). Subsequently, tectal activity returned to baseline (p = 0.05), whereas synaptic efficacy remained significantly depressed. Units and fEPSPs were calculated and expressed as in Figure 4. Error bars indicate SEM.
Figure 13.
Figure 13.
Silencing retina potentiates the toral fEPSP. Visual activity in one eye was blocked by intraocular TTX injection (time 0) after a baseline recording period (time −30 to 0). Toral fEPSPs (filled circles and inset) evoked in one tectum by stimulation of the torus longitudinalis exhibited a significant potentiation to 191.6 ± 30.3% of baseline within 90 min (*p < 0.01). The toral fEPSP in control fish (open circles) that had not received TTX in either eye exhibited no significant change over a similar period of time. Toral fEPSPs were calculated and expressed as in Figure 4. Error bars indicate SEM. Calibration: 6 ms, 0.1 mV.

Similar articles

Cited by

References

    1. Abraham WC, Bear MF. Metaplasticity: the plasticity of synaptic plasticity. Trends Neurosci. 1996;19:126–130. - PubMed
    1. Aizenman CD, Akerman CJ, Jensen KR, Cline HT. Visually driven regulation of intrinsic neuronal excitability improves stimulus detection in vivo. Neuron. 2003;39:831–842. - PubMed
    1. Buonomano DV, Merzenich MM. Cortical plasticity: from synapses to maps. Annu Rev Neurosci. 1998;21:149–186. - PubMed
    1. Burrone J, Murthy VN. Synaptic gain control and homeostasis. Curr Opin Neurobiol. 2003;13:560–567. - PubMed
    1. Burrone J, O'Byrne M, Murthy VN. Multiple forms of synaptic plasticity triggered by selective suppression of activity in individual neurons. Nature. 2002;420:414–418. - PubMed

Publication types

MeSH terms

LinkOut - more resources