. 2007 Sep 26;27(39):10621-35.
doi: 10.1523/JNEUROSCI.2163-07.2007.

Cell surface AMPA receptors in the rat nucleus accumbens increase during cocaine withdrawal but internalize after cocaine challenge in association with altered activation of mitogen-activated protein kinases

Affiliations

Cell surface AMPA receptors in the rat nucleus accumbens increase during cocaine withdrawal but internalize after cocaine challenge in association with altered activation of mitogen-activated protein kinases

Amy C Boudreau et al. J Neurosci. .

Abstract

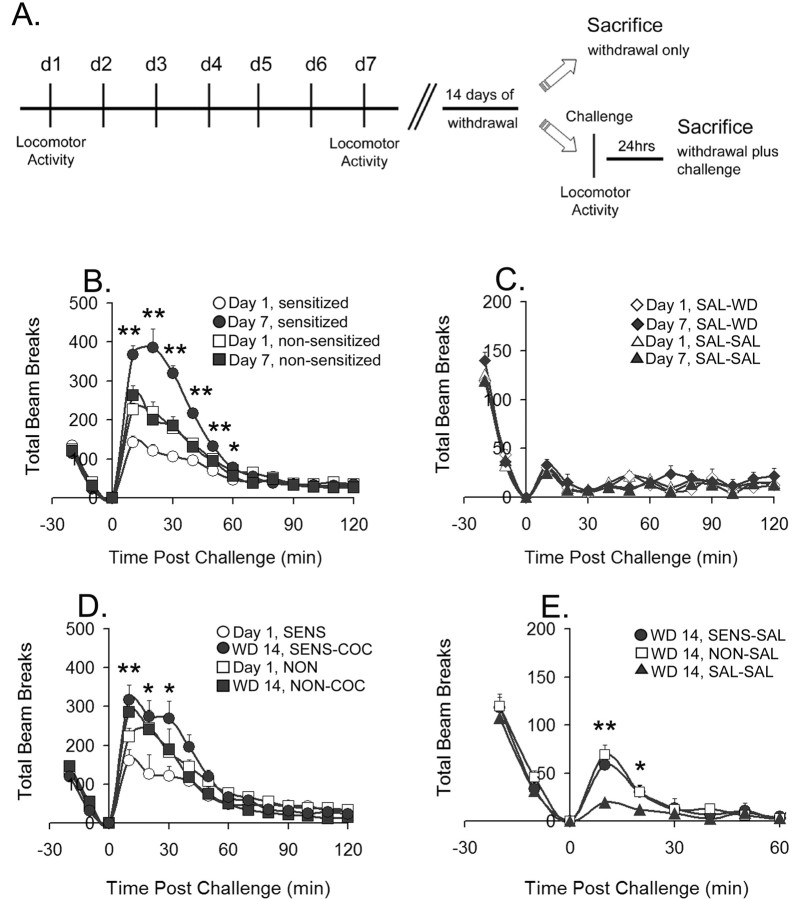
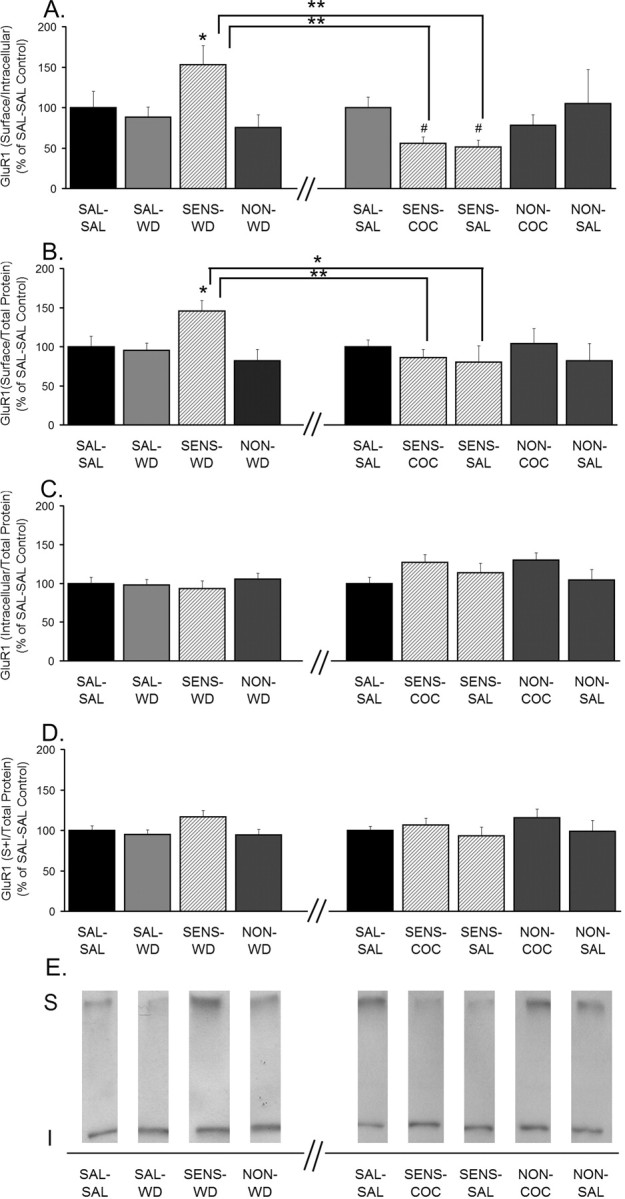
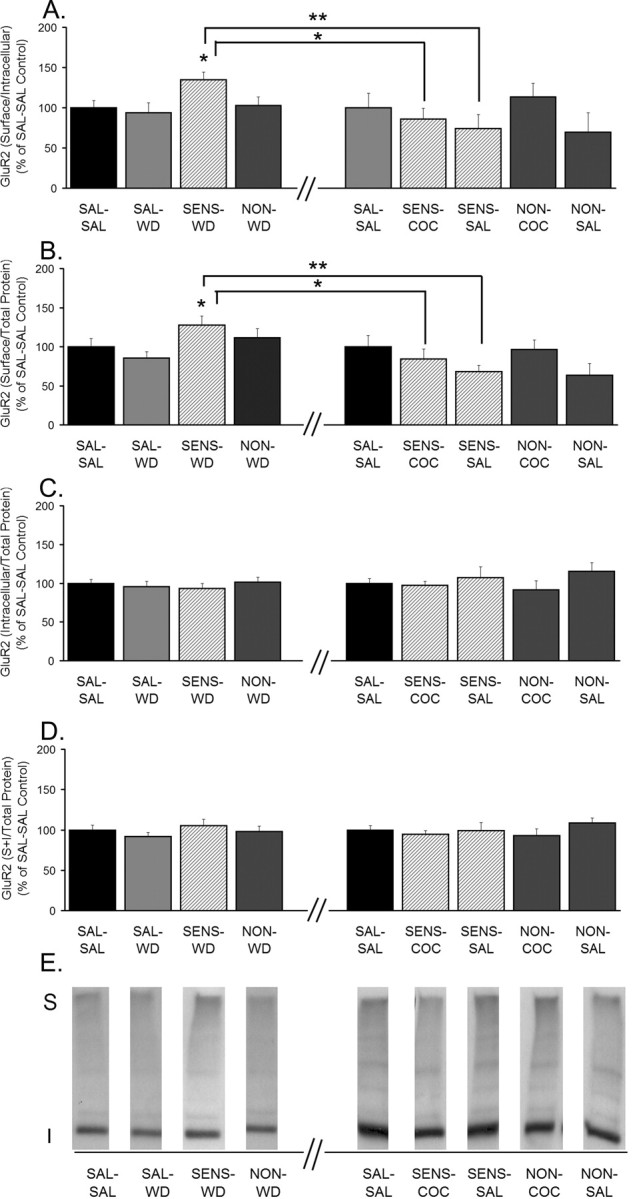
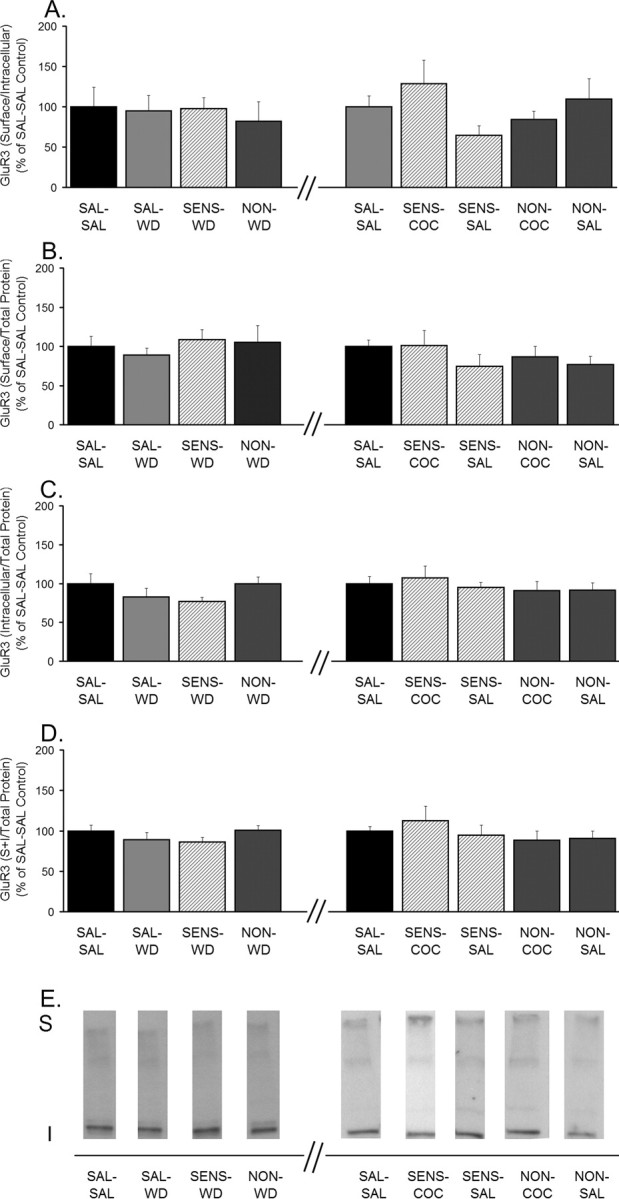
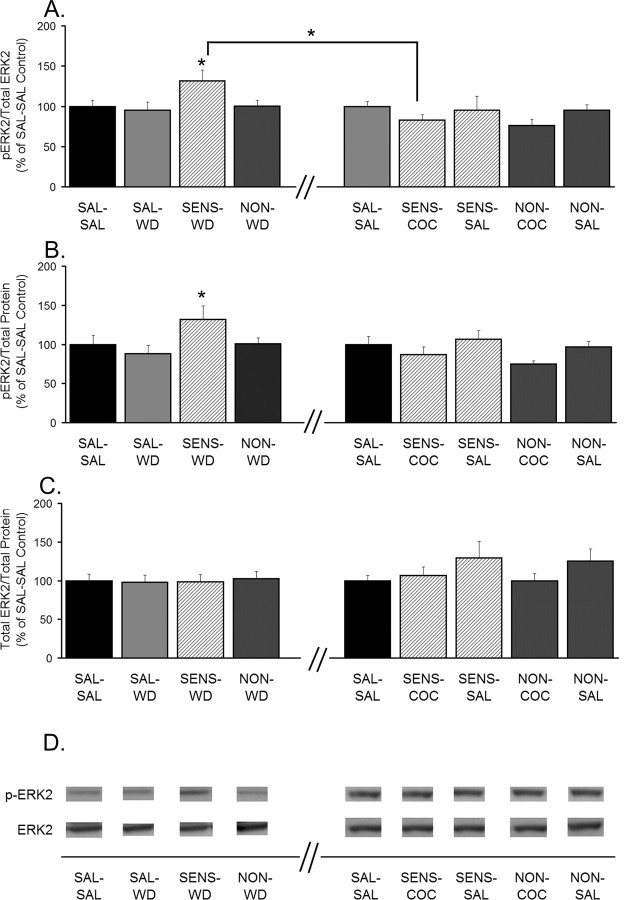
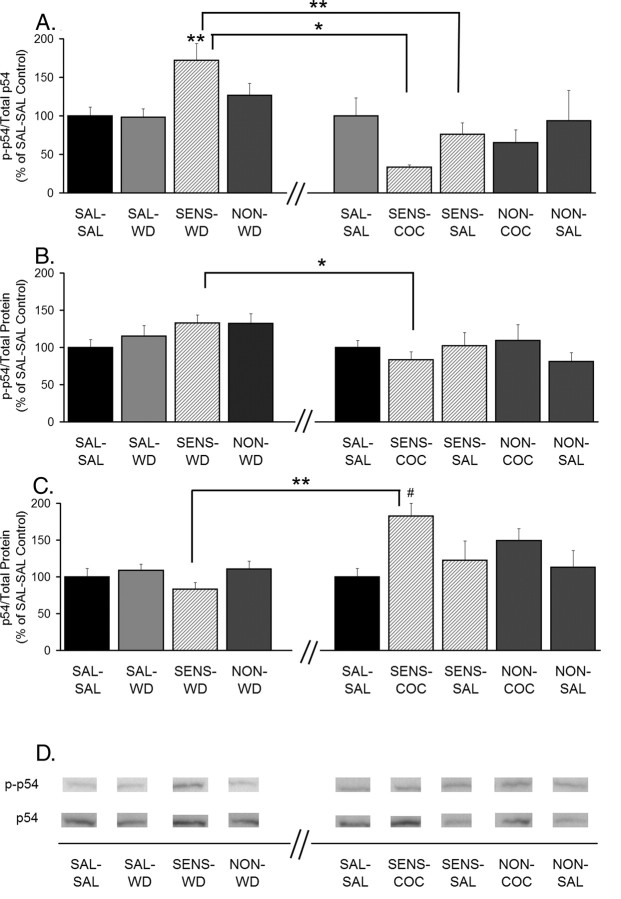
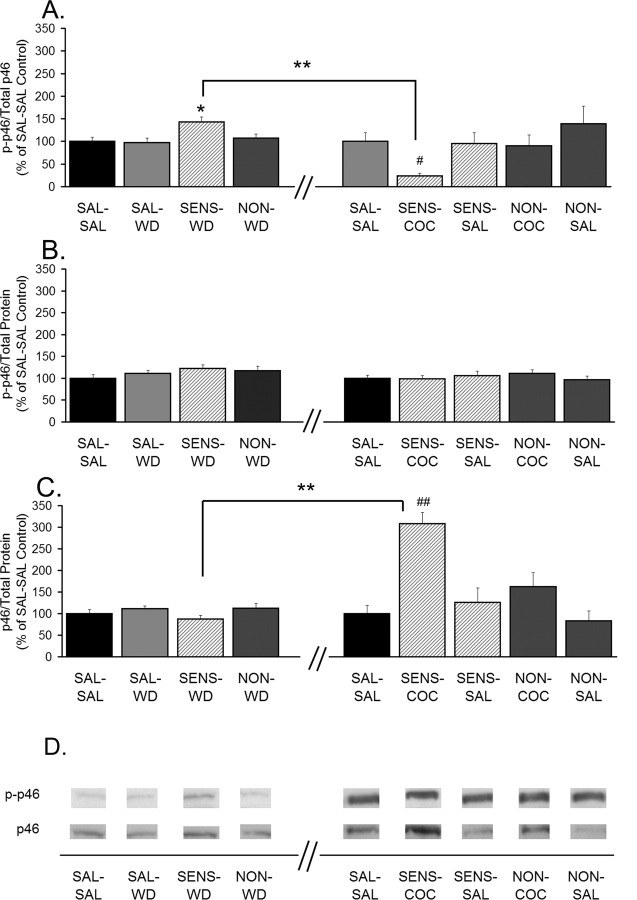
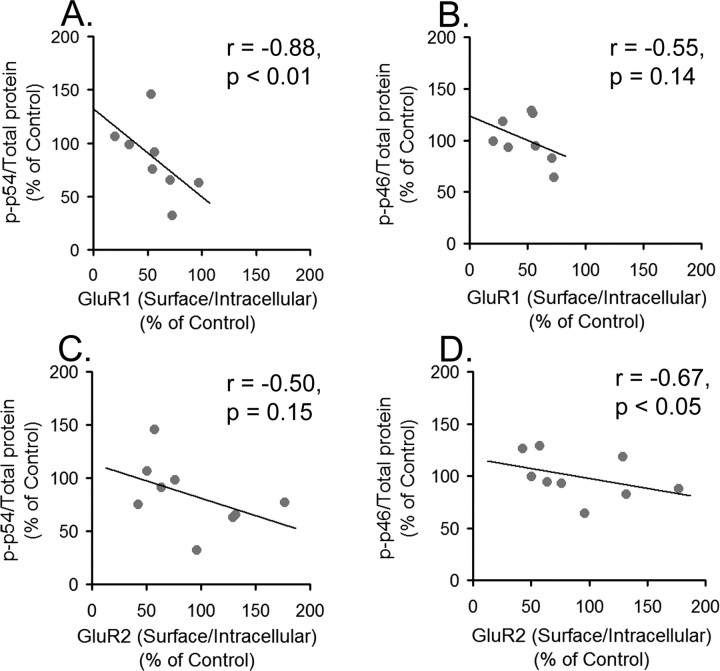
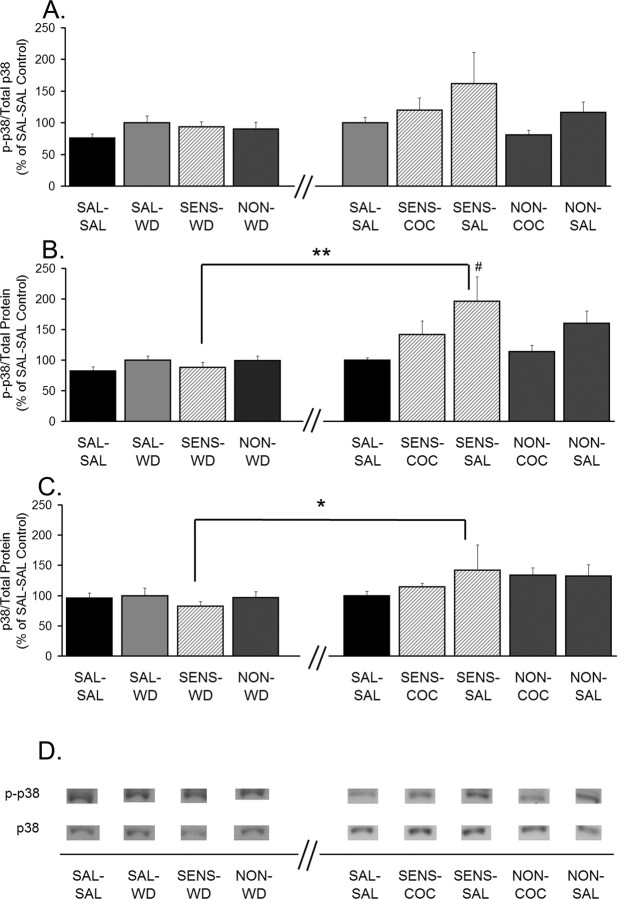
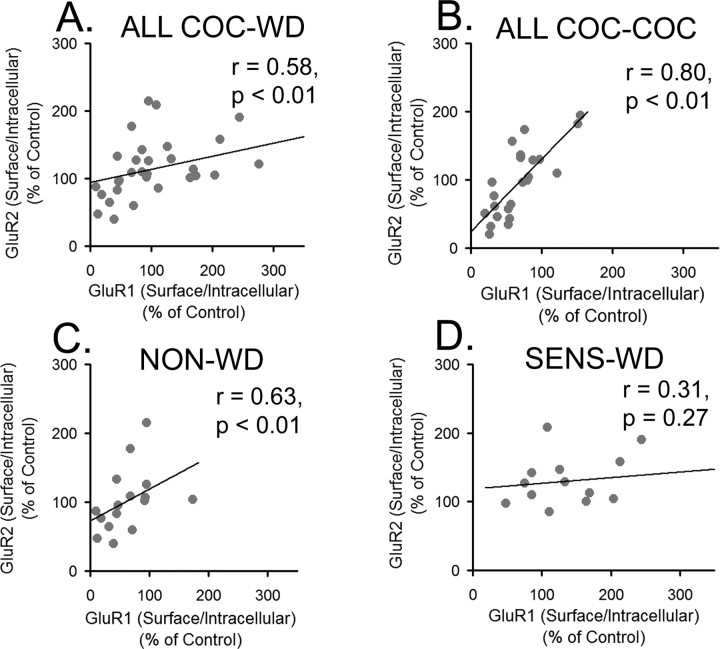
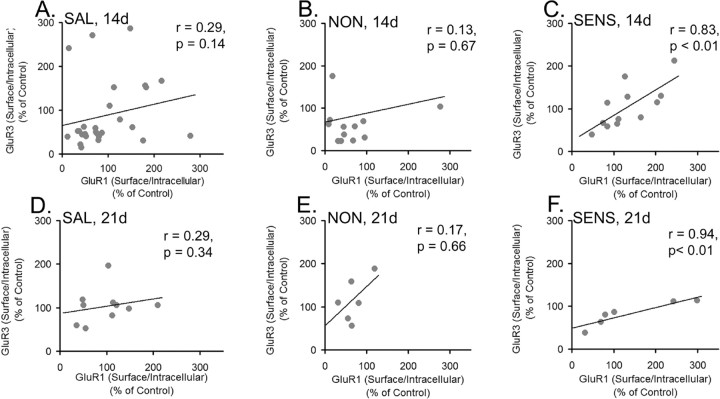
Although some studies report increased responsiveness of nucleus accumbens (NAc) AMPA receptors (AMPARs) after withdrawal from repeated cocaine treatment, others report decreased responsiveness after withdrawal plus cocaine challenge. Here we examine this apparent contradiction by quantifying cell surface and intracellular AMPAR subunits in the NAc before and after a challenge injection in behaviorally sensitized rats. Because MAPKs (mitogen-activated protein kinases) regulate AMPAR trafficking and are implicated in addiction, we also evaluated phosphorylation of extracellular signal-regulated kinase (ERK), c-Jun N-terminal kinase (JNK), and p38. Glutamate receptor 1 (GluR1) and GluR2 surface/intracellular (S/I) ratios were increased after 14 d of withdrawal in sensitized rats but were decreased 24 h after challenge with cocaine (which elicited a sensitized locomotor response) or saline (which elicited conditioned locomotion). These findings suggested redistribution of GluR1/2-containing receptors, a possibility supported by immunoprecipitation experiments indicating that most AMPARs in the NAc are GluR1/2 or GluR2/3, with few homomeric GluR1 or GluR1/3 receptors. In sensitized rats, ERK phosphorylation in the NAc increased during withdrawal and normalized after cocaine challenge. JNK phosphorylation also increased after withdrawal, but after cocaine challenge, it was inversely related to GluR1 and GluR2 S/I ratios. After saline challenge, p38 phosphorylation was increased. In summary, surface expression of GluR1/2-containing AMPARs increased in the NAc of sensitized rats, but AMPARs internalized after a single reexposure to cocaine or cocaine-related cues. ERK phosphorylation paralleled AMPAR surface expression. Although JNK results were complex, JNK and p38 may be involved in AMPAR internalization after cocaine or saline challenge, respectively.


Figures

Figure 1.
Figure 1.
Repeated cocaine injections produce behavioral sensitization and conditioned locomotion. A, Schematic depiction of experimental design. d1, Day 1. B, Locomotor activity data for cocaine-sensitized and -nonsensitized animals on the first day (Day 1) and last day (Day 7) of repeated cocaine injections; sum of five independent trials (see Materials and Methods for criteria for sensitization); n = 37 sensitized; n = 49 nonsensitized. Rats shown in B were further divided such that some underwent 14 d of withdrawal before biochemical analysis, whereas others received a challenge injection (cocaine or saline) on day 14 of withdrawal and were killed 24 h later. This generated a total of six repeated cocaine groups: SENS-WD, NON-WD, SENS-COC, SENS-SAL, NON-COC, and NON-SAL; n = 9–20 per group. C, Locomotor activity, on the first and last day of repeated saline injections, of SAL-WD or SAL-SAL rats before biochemical analysis; sum of five independent trials; n = 16–30 per group. D, Locomotor activity of sensitized and nonsensitized rats on the first day of cocaine treatment (Day 1, SENS; Day 1, NON) and after cocaine challenge on withdrawal day 14 (WD 14, SENS-COC; WD 14, NON-COC). E, Locomotor activity after saline challenge after 14 d of withdrawal in sensitized (WD 14, SENS-SAL), nonsensitized (WD 14, NON-SAL), and saline-treated rats (WD 14, SAL-SAL). All data are expressed as mean ± SEM total beam breaks. *p < 0.05; **p < 0.01; B, Day 1, sensitized versus Day 7, sensitized; D, Day 1, SENS versus WD 14, SENS-COC; E, WD 14, SAL-SAL versus WD 14, SENS-SAL and WD 14, NON-SAL.
Figure 2.
Figure 2.
GluR1 S levels and S/I ratios are increased in sensitized rats after 14 d of withdrawal but decreased 24 h after a cocaine or saline challenge. A, GluR1 S/I ratio. B, GluR1 S levels normalized to total protein in the lane (S/total protein). C, GluR1 I levels normalized to total protein in the lane (I/total protein). D, GluR1 total protein levels normalized to total protein in the lane [(S + I)/total protein]. Data (mean ± SEM) are normalized to SAL-SAL controls and represent the sum of four independent experiments (2 withdrawal only and 2 withdrawal plus challenge). Data to the left of the x-axis break represent values from withdrawal-only groups. Data to the right of the x-axis break represent values from withdrawal-plus-challenge groups. SAL-SAL (n = 12–15; each group), SAL-WD (n = 14–16), SENS-WD (n = 14–16), NON-WD (n = 16–18), SENS-COC (n = 12), SENS-SAL (n = 7–9), NON-COC (n = 12–14), and NON-SAL (n = 11–13) are shown. Significant differences between withdrawal and withdrawal plus challenge are indicated by brackets: *p < 0.05; **p < 0.01. Comparisons among withdrawal groups or withdrawal-plus-challenge groups: *p < 0.05, significantly different from saline control groups (SAL-SAL and SAL-WD) and NON-WD group; #p < 0.05, significantly different from SAL-SAL group. E, Representative immunoblots.
Figure 3.
Figure 3.
GluR2 S levels and S/I ratios are increased in sensitized rats after 14 d of withdrawal but decreased 24 h after a cocaine or saline challenge. A, GluR2 S/I ratio. B, GluR2 S levels normalized to total protein in the lane (S/total protein). C, GluR2 I levels normalized to total protein in the lane (I/total protein). D, GluR2 total protein levels normalized to total protein in the lane [(S + I)/total protein]. Data (mean ± SEM) are normalized to SAL-SAL controls and represent the sum of four independent experiments (2 withdrawal only and 2 withdrawal plus challenge). Data to the left of the x-axis break represent values from withdrawal-only groups. Data to the right of the x-axis break represent values from withdrawal-plus-challenge groups. SAL-SAL (n = 12–15; each group), SAL-WD (n = 14–16), SENS-WD (n = 14–16), NON-WD (n = 16–18), SENS-COC (n = 12), SENS-SAL (n = 7–9), NON-COC (n = 12–14), and NON-SAL (n = 11–13) are shown. Significant differences between withdrawal and withdrawal plus challenge are indicated by brackets: *p < 0.05; **p < 0.01. Comparisons among withdrawal groups: *p < 0.05, significantly different from saline control groups (SAL-SAL and SAL-WD). E, Representative immunoblots.
Figure 4.
Figure 4.
Distribution of GluR3 is unchanged after 14 d of withdrawal and after withdrawal plus challenge. A, GluR3 S/I ratio. B, GluR3 S levels normalized to total protein in the lane (S/total protein). C, GluR3 I levels normalized to total protein in the lane (I/total protein). D, GluR3 total protein levels normalized to total protein in the lane [(S + I)/total protein]. Data (mean ± SEM) are normalized to SAL-SAL controls and represent the sum of four independent experiments (2 withdrawal only and 2 withdrawal plus challenge). Data to the left of the x-axis break represent values from withdrawal-only groups. Data to the right of the x-axis break represent values from withdrawal-plus-challenge groups. SAL-SAL (n = 12–15; each group), SAL-WD (n = 14–16), SENS-WD (n = 14–16), NON-WD (n = 16–18), SENS-COC (n = 12), SENS-SAL (n = 7–9), NON-COC (n = 12–14), and NON-SAL (n = 11–13) are shown. ANOVA revealed no significant differences. E, Representative immunoblots.
Figure 5.
Figure 5.
ERK2 phosphorylation is increased after 14 d of withdrawal but not 24 h after a cocaine or saline challenge. A, Phospho-ERK2 normalized to total ERK2 protein (pERK2/total ERK2). B, Phospho-ERK2 normalized to total protein in the lane (pERK2/total protein). C, Total ERK2 levels normalized to total protein in the lane (ERK2/total protein). Data (mean ± SEM) are normalized to SAL-SAL controls and represent the sum of four independent experiments (2 withdrawal only and 2 withdrawal plus challenge). Data to the left of the x-axis break represent values from withdrawal-only groups. Data to the right of the x-axis break represent values from withdrawal-plus-challenge groups. SAL-SAL (n = 12–15; each group), SAL-WD (n = 14–16), SENS-WD (n = 14–16), NON-WD (n = 16–18), SENS-COC (n = 12), SENS-SAL (n = 7–9), NON-COC (n = 12–14), and NON-SAL (n = 11–13) are shown. Significant differences between withdrawal and withdrawal plus challenge are indicated by brackets: *p < 0.05. Comparisons among withdrawal groups: *p < 0.05, significantly different from saline control groups (SAL-SAL and SAL-WD). D, Representative immunoblots.
Figure 6.
Figure 6.
JNK p54 phosphorylation is increased in sensitized rats after 14 d of withdrawal, whereas total protein levels of JNK p54 are increased 24 h after a cocaine challenge. A, Phospho-p54 normalized to total p54 protein (p-p54/total p54). B, Phospho-p54 normalized to total protein in the lane (p-p54/total protein). C, Total p54 levels normalized to total protein in the lane (p54/total protein). Data (mean ± SEM) are normalized to SAL-SAL controls and represent the sum of four independent experiments (2 withdrawal only and 2 withdrawal plus challenge). Data to the left of the x-axis break represent values from withdrawal-only groups. Data to the right of the x-axis break represent values from withdrawal-plus-challenge groups. SAL-SAL (n = 12–15; each group), SAL-WD (n = 14–16), SENS-WD (n = 14–16), NON-WD (n = 16–18), SENS-COC (n = 12), SENS-SAL (n = 7–9), NON-COC (n = 12–14), and NON-SAL (n = 11–13) are shown. Significant differences between withdrawal and withdrawal plus challenge are indicated by brackets: *p < 0.05; **p < 0.01. Comparisons among withdrawal or withdrawal-plus-challenge groups: **p < 0.01, significantly different from saline control groups (SAL-SAL and SAL-WD) and NON-WD group; #p < 0.05, significantly different from SAL-SAL group. D, Representative immunoblots.
Figure 7.
Figure 7.
JNK p46 phosphorylation is increased in sensitized rats after 14 d of withdrawal, whereas total protein levels of JNK p46 are increased 24 h after a cocaine challenge. A, Phospho-p46 normalized to total p46 protein (p-p46/total p46). B, Phospho-p46 normalized to total protein in the lane (p-p46/total protein). C, Total p46 levels normalized to total protein in the lane (total p46/total protein). Data (mean ± SEM) are normalized to SAL-SAL controls and represent the sum of four independent experiments (2 withdrawal only and 2 withdrawal plus challenge). Data to the left of the x-axis break represent values from withdrawal-only groups. Data to the right of the x-axis break represent values from withdrawal-plus-challenge groups. SAL-SAL (n = 12–15; each group), SAL-WD (n = 14–16), SENS-WD (n = 14–16), NON-WD (n = 16–18), SENS-COC (n = 12), SENS-SAL (n = 7–9), NON-COC (n = 12–14), and NON-SAL (n = 11–13) are shown. Significant differences between withdrawal and withdrawal plus challenge are indicated by brackets: **p < 0.01. Comparisons among withdrawal-only groups: *p < 0.05, significantly different from saline control groups (SAL-SAL and SAL-WD) and NON-WD group. Comparisons among withdrawal-plus-challenge groups: #p < 0.05, relative to SAL-SAL and SENS-SAL groups; ##p < 0.01, relative to SAL-SAL, SENS-SAL, NON-COC, and NON-SAL groups. D, Representative immunoblots.
Figure 8.
Figure 8.
GluR1 and GluR2 S/I ratios are inversely proportional to JNK p54 and p46 phosphorylation in cocaine-sensitized rats 24 h after a cocaine challenge. A, Relationship between phospho-p54 normalized to total protein in the lane (p-p54/total protein) and the GluR1 S/I ratio after cocaine challenge in sensitized rats. B, Relationship between phospho-p46 normalized to total protein in the lane (p-p46/total protein) and the GluR1 S/I ratio after cocaine challenge in sensitized rats. C, Relationship between p-p54/total protein and the GluR2 S/I ratio after cocaine challenge in sensitized rats. D, Relationship between p-p46/total protein and the GluR2 S/I ratio after cocaine challenge in sensitized rats. r is the Spearman rank-order correlation coefficient. We could not measure both parameters in some rats, because of technical problems with one of the blots, accounting for a lower sample number in some of these analyses than in behavioral analyses.
Figure 9.
Figure 9.
p38 phosphorylation is increased only after saline challenge in cocaine-sensitized rats. A, Phospho-p38 normalized to total p38 protein (p-p38/total p38). B, Phospho-p38 normalized to total protein in the lane (p-p38/total protein). C, Total p38 levels normalized to total protein in the lane (p38/total protein). Data (mean ± SEM) are normalized to SAL-SAL controls and represent the sum of four independent experiments (2 withdrawal only and 2 withdrawal plus challenge). Data to the left of the x-axis break represent values from withdrawal-only groups. Data to the right of the x-axis break represent values from withdrawal-plus-challenge groups. SAL-SAL (n = 12–15; each group), SAL-WD (n = 14–16), SENS-WD (n = 14–16), NON-WD (n = 16–18), SENS-COC (n = 12), SENS-SAL (n = 7–9), NON-COC (n = 12–14), and NON-SAL (n = 11–13) are shown. Significant differences between withdrawal and withdrawal plus challenge are indicated by brackets: *p < 0.05; **p < 0.01. Significant differences among withdrawal-plus-challenge groups: #p < 0.05, relative to the SAL-SAL group. D, Representative immunoblots.
Figure 10.
Figure 10.
GluR1 and GluR2 S/I ratios are positively correlated in all cocaine rats subjected to withdrawal, but the relationship is lost when sensitized rats subjected to withdrawal are analyzed separately. A, GluR1 S/I ratios versus GluR2 S/I ratios in all COC-WD rats. B, GluR1 S/I ratio versus GluR2 S/I ratio in all COC-COC rats. C, GluR1 S/I ratios versus GluR2 S/I ratios in NON-WD rats. D, GluR1 S/I ratios versus GluR2 S/I ratios in SENS-WD rats. r is the Spearman rank-order correlation coefficient. For some rats, S/I ratio data were only obtained for one subunit (GluR1 or GluR2), accounting for a lower sample number in some of these analyses than in behavioral analyses.
Figure 11.
Figure 11.
GluR1 and GluR3 S/I ratios are positively correlated in sensitized rats, but not nonsensitized or saline-treated rats, at both 14 and 21 d of withdrawal. A, GluR1 S/I ratios versus GluR3 S/I ratios in saline-treated rats after 14 d of withdrawal (SAL, 14d). B, GluR1 S/I ratios versus GluR3 S/I ratios in nonsensitized rats after 14 d of withdrawal (NON, 14d). C, GluR1 S/I ratios versus GluR3 S/I ratios in sensitized rats after 14 d of withdrawal (SENS, 14d). D, GluR1 S/I ratios versus GluR3 S/I ratios in saline-treated rats after 21 d of withdrawal (SAL, 21d). E, GluR1 S/I ratios versus GluR3 S/I ratios in nonsensitized rats after 21 d of withdrawal (NON, 21d). F, GluR1 S/I ratios versus GluR3 S/I ratios in sensitized rats after 21 d of withdrawal (SENS, 21d). r is the Spearman rank-order correlation coefficient. For some rats, S/I ratio data were only obtained for one subunit (GluR1 or GluR3), accounting for a lower sample number in some of these analyses than in behavioral analyses. Samples from withdrawal day 21 were from rats generated as part of a previous study (Boudreau and Wolf, 2005).

Comment in

References

    1. Baker DA, McFarland K, Lake RW, Shen H, Tang XC, Toda S, Kalivas PW. Neuroadaptations in cystine-glutamate exchange underlie cocaine relapse. Nat Neurosci. 2003;6:743–749. - PubMed
    1. Bell K, Duffy P, Kalivas PW. Context-specific enhancement of glutamate transmission by cocaine. Neuropsychopharmacology. 2000;23:335–344. - PubMed
    1. Boudreau AC, Wolf ME. Behavioral sensitization to cocaine is associated with increased AMPA receptor surface expression in the nucleus accumbens. J Neurosci. 2005;25:9144–9151. - PMC - PubMed
    1. Boudreau AC, Wolf ME. Dysregulation of signal transduction accompanies AMPA receptor trafficking in the nucleus accumbens during behavioral sensitization to cocaine. Soc Neurosci Abstr. 2006;32:394–7.
    1. Brebner K, Wong TP, Liu L, Liu Y, Campsall P, Gray S, Phelps L, Phillips AG, Wang YT. Nucleus accumbens long-term depression and the expression of behavioral sensitization. Science. 2005;310:1340–1343. - PubMed

Publication types

MeSH terms