. 2007 Sep 26;27(39):10636-45.
doi: 10.1523/JNEUROSCI.1228-07.2007.

Myosin va mediates docking of secretory granules at the plasma membrane

Affiliations

Myosin va mediates docking of secretory granules at the plasma membrane

Claire Desnos et al. J Neurosci. .

Abstract

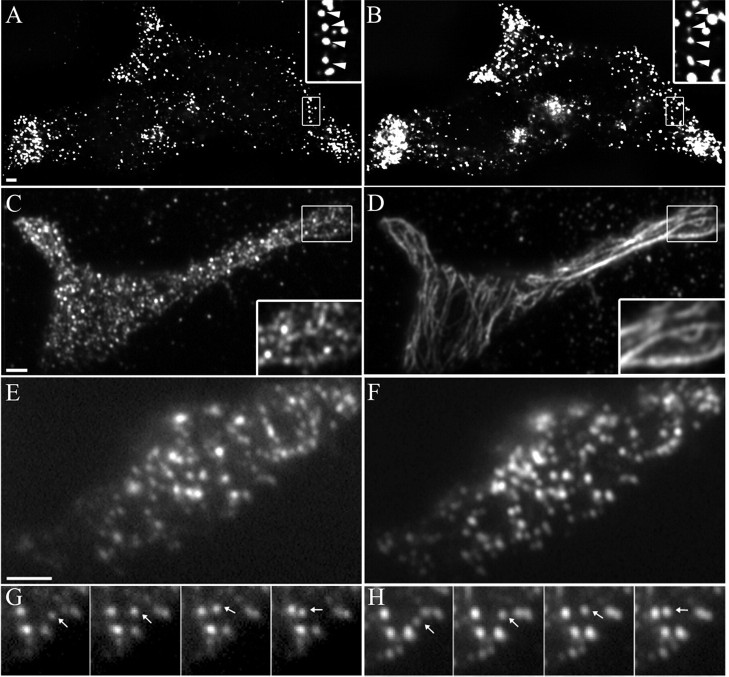
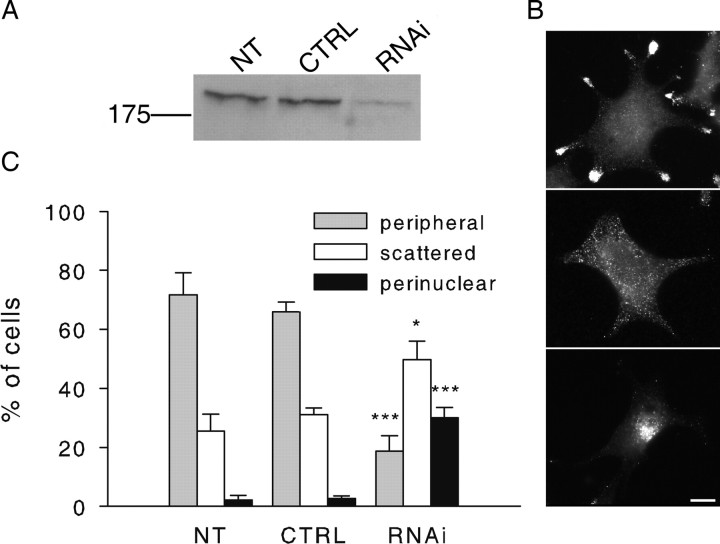
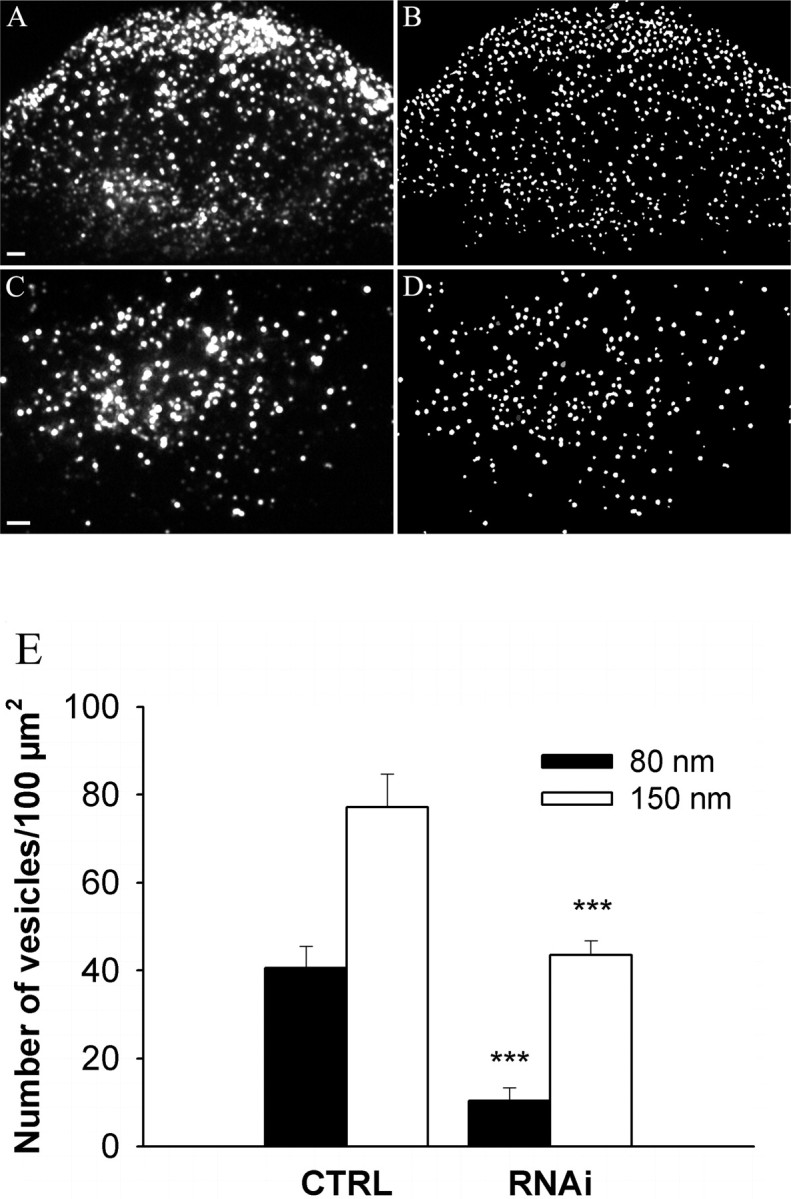
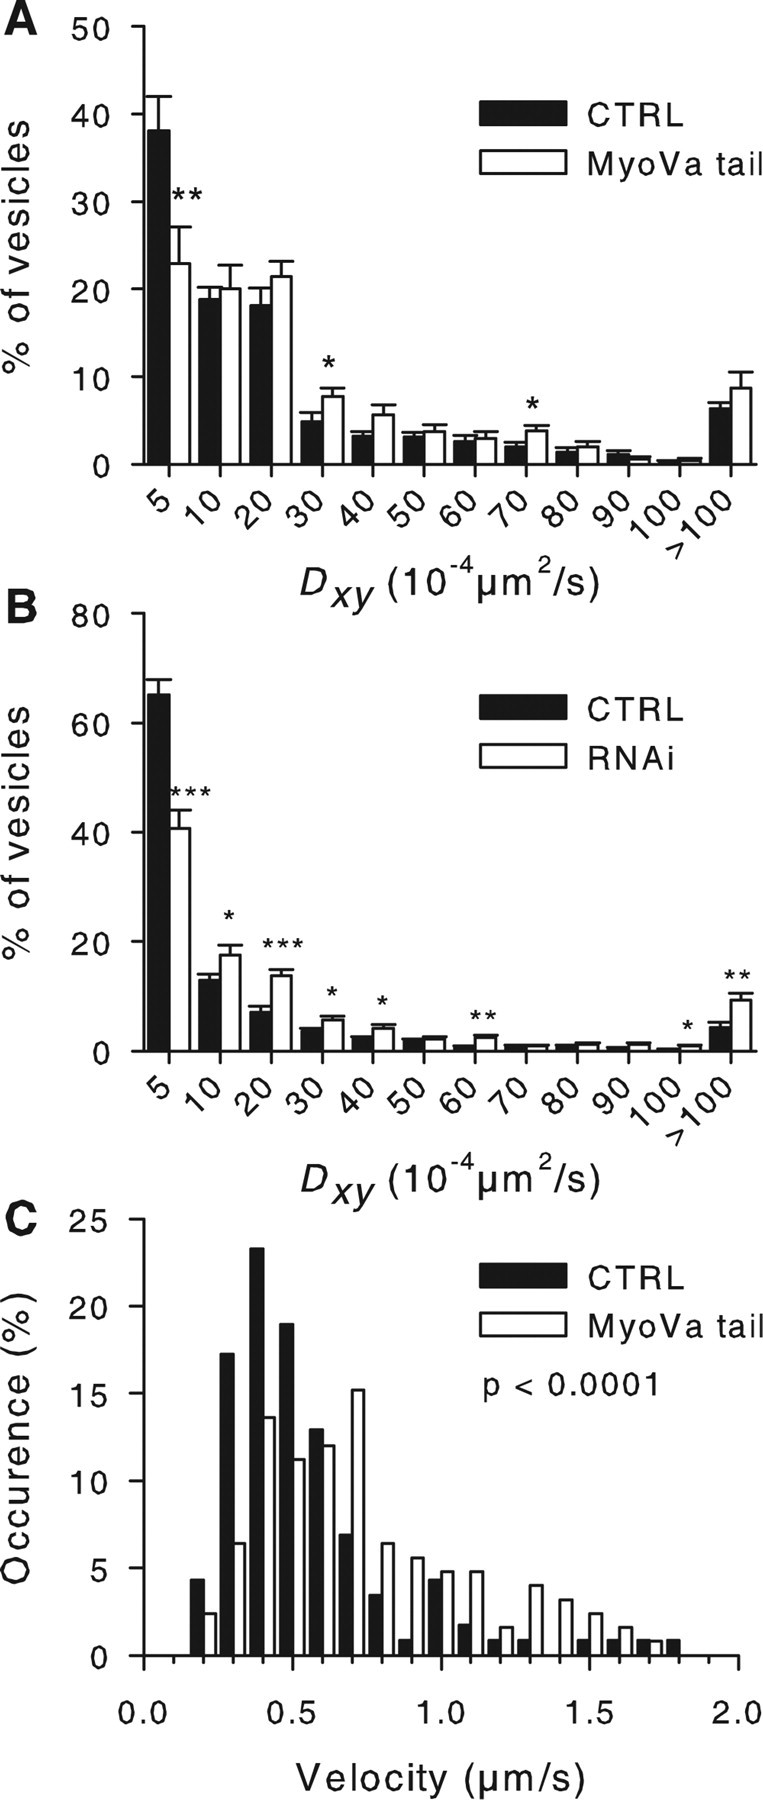
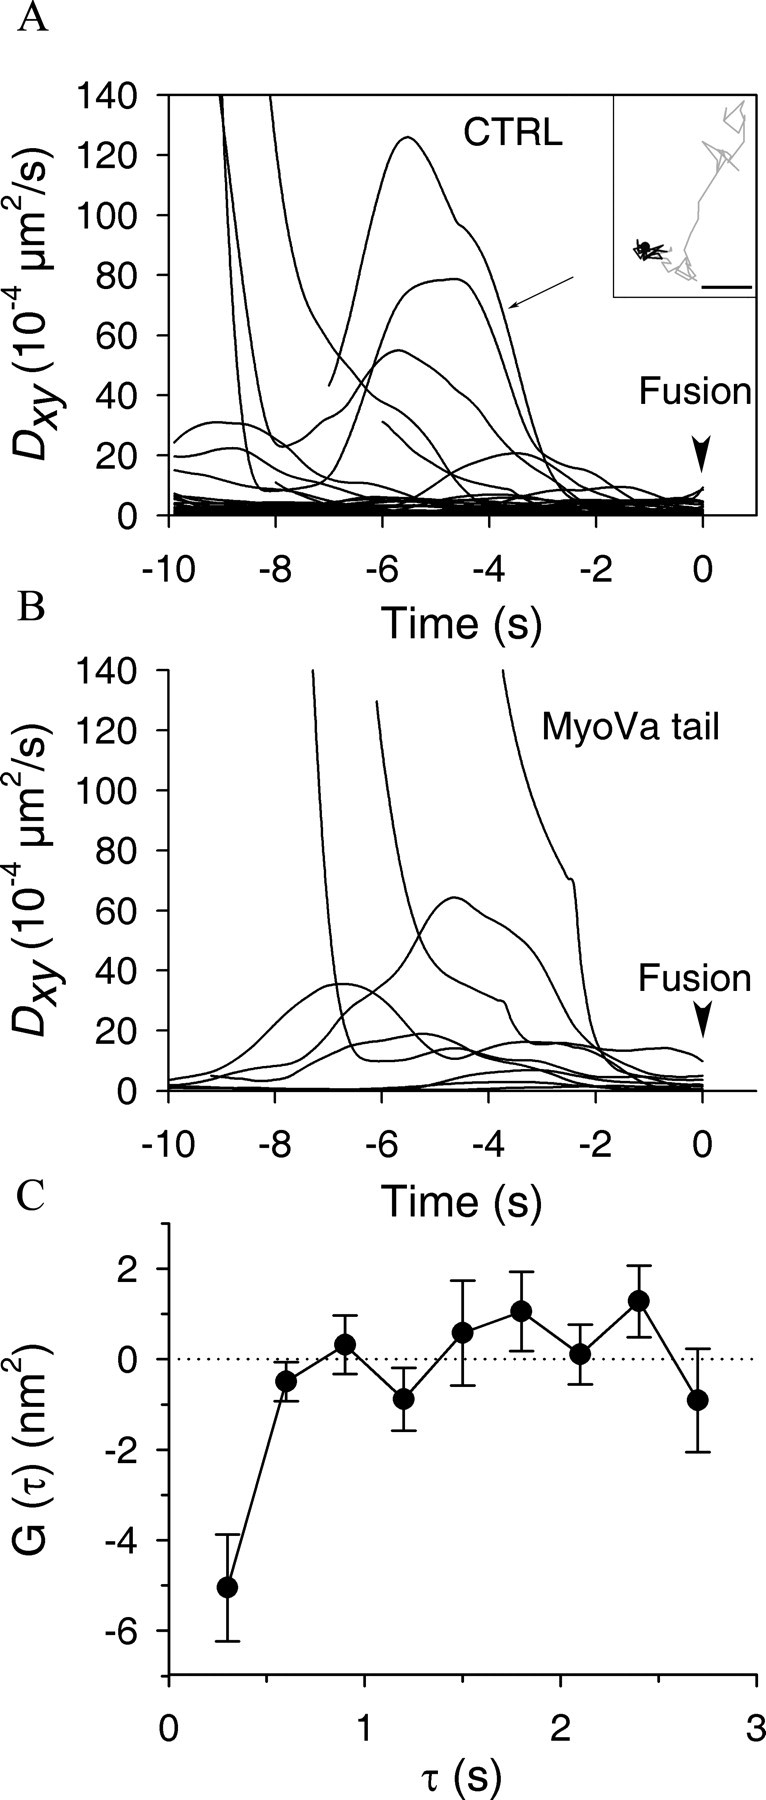
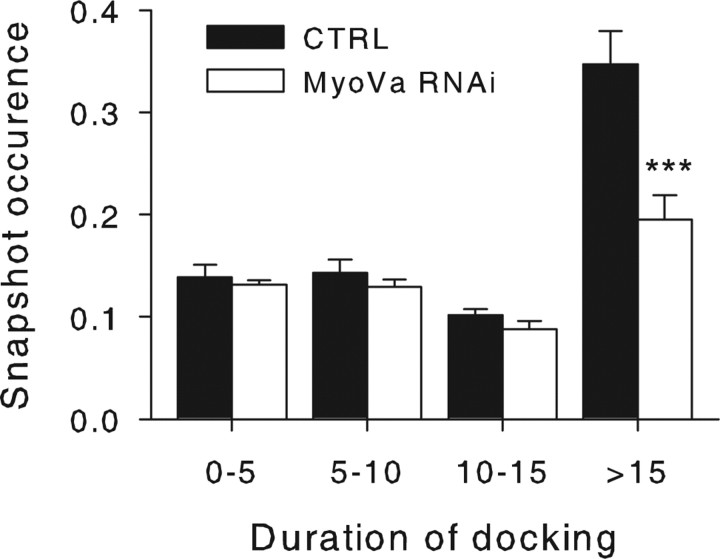
Myosin Va (MyoVa) is a prime candidate for controlling actin-based organelle motion in neurons and neuroendocrine cells. Its function in secretory granule (SG) trafficking was investigated in enterochromaffin cells by wide-field and total internal reflection fluorescence microscopy. The distribution of endogenous MyoVa partially overlapped with SGs and microtubules. Impairing MyoVa function by means of a truncated construct (MyoVa tail) or RNA interference prevented the formation of SG-rich regions at the cell periphery and reduced SG density in the subplasmalemmal region. Individual SG trajectories were tracked to analyze SG mobility. A wide distribution of their diffusion coefficient, D(xy), was observed. Almost immobile SGs (D(xy) < 5 x 10(-4) microm2 x s(-1)) were considered as docked at the plasma membrane based on two properties: (1) SGs that undergo exocytosis have a D(xy) below this threshold value for at least 2 s before fusion; (2) a negative autocorrelation of the vertical motion was found in subtrajectories with a D(xy) below the threshold. Using this criterion of docking, we found that the main effect of MyoVa inhibition was to reduce the number of docked granules, leading to reduced secretory responses. Surprisingly, this reduction was not attributable to a decreased transport of SGs toward release sites. In contrast, MyoVa silencing reduced the occurrence of long-lasting, but not short-lasting, docking periods. We thus propose that, despite its known motor activity, MyoVa directly mediates stable attachment of SGs at the plasma membrane.


Figures

Figure 1.
Figure 1.
Association of myosin Va with secretory granules. A, B, The distribution of endogenous MyoVa in BON cells was analyzed using a polyclonal anti-MyoVa antibody and an Alexa Fluor 555-coupled secondary antibody (A) and compared with the distribution of SGs labeled by expressing NPY-GFP (B). The stacks of images of these two cells were restored by deconvolution. SGs and MyoVa appear as small individual dots enriched in cellular extensions. Zoomed-in regions are shown in inset with arrows depicting examples of MyoVa-positive SGs. C, D, Localization of MyoVa along microtubules. BON cells were double stained with anti-MyoVa (C) and anti-tubulin (D) antibodies and imaged by two-color TIRFM. Several MyoVa-positive dots are aligned along microtubules (see zoomed-in regions in inset). E, F, BON cells expressing GFP-MyoVa tail (E) and NPY-mRFP (F) were imaged successively in red and green channels at 4 Hz by two-color TIRFM. Most of the GFP-MyoVa tail-labeled structures (E) codistributed with NPY-mRFP-labeled SGs (F). G, H, A single granule displaying a directed motion (depicted with arrows) is shown in successive frames. Note that GFP-MyoVa tail (G) and NPY-mRFP (H) moved together. Scale bars, 1 μm.
Figure 2.
Figure 2.
Myosin Va silencing impairs SG distribution. A, BON cells were transfected with different siRNA duplexes for 3 d. Levels of MyoVa were analyzed by immunoblotting in nontransfected cells (NT), in cells treated with a control siRNA (CTRL), and in cells treated with siRNAs directed to MyoVa (RNAi-1). Shown is the result of a typical experiment. B, Different patterns of SG distribution. SGs, here labeled with anti-Rab27a antibodies, are generally enriched at the cell periphery and in cellular extensions (top panel). On MyoVa silencing, SGs are frequently scattered in the cell (middle panel) or concentrated in the perinuclear region (bottom panel). Scale bar, 10 μm. C, Quantification of the effect of MyoVa silencing on SG distribution. BON cells were stained with anti-Rab27a or chromogranin A/B antibodies and classified into three categories according to the distribution of SGs: enriched at the periphery of the cell footprint, scattered, or concentrated in the perinuclear region as depicted in B. Shown is the mean percentage of cells observed for each category in nontransfected cells (NT) (n = 3; 652 cells) and in cells treated with control siRNA (CTRL) (n = 4; 777 cells) or MyoVa RNAi-1 (n = 4; 843 cells). Error bars indicate SE. * p < 0.05; ***p < 0.001.
Figure 3.
Figure 3.
Myosin Va controls the cortical density of SGs. AD, BON cells were transfected with a control siRNA duplex (A, B) (20 cells) or MyoVa RNAi-1 (C, D) (19 cells) and cotransfected with pNPY-GFP. NPY-GFP-containing SGs were imaged by TIRFM (A, C). Note in A that SGs are not homogenously distributed but are enriched at the periphery of the cell footprint. The density of SGs was reduced by MyoVa silencing (C) and the areas enriched in SGs disappeared. To quantify the number of SGs, images were segmented using Multidimensional Image Analysis software (B, D). Scale bars, 2 μm. E, Quantification of the data. For each cell, the density of SGs in the subplasmalemmal region was determined by dividing the number of SGs observed in the evanescent field by the size of the cell footprint. The penetration depth δ was set to 80 nm (filled bars) or 150 nm (open bars). Shown is the result of one experiment (mean ± SE). Similar results were obtained in two other ones. ***p < 0.001.
Figure 4.
Figure 4.
MyoVa inhibition modifies SG mobility in the subplasmalemmal region. A, BON cells were transfected with pNPY-mRFP (CTRL; filled bars) or with pNPY-mRFP and pEGFP-MyoVa-tail (MyoVa tail; open bars) and imaged by TIRFM for 75 s at 4 Hz. To characterize the mobility of SGs, their trajectories (CTRL, 832 SGs; MyoVa tail, 653 SGs) were tracked and mean diffusion coefficient Dxy was computed (see Materials and Methods). The distribution of Dxy values was then calculated in each cell. Shown is the mean ± SE of the values obtained for each bin in the different cells (13 cells from 2 independent experiments in each group). Note the diminution of the percentage of SGs with Dxy < 5 × 10⁻⁴ μm2/s that are presumably docked. Similar effects were observed under stimulating conditions (supplemental Fig. 3, available at www.jneurosci.org as supplemental material). B, MyoVa silencing had an effect on the distribution of Dxy values similar to that of MyoVa tail [CTRL, 20 cells (1391 SGs); MyoVa RNAi, 20 cells (1431 SGs) from two independent experiments]. C, SGs moving in a directed manner (supplemental Fig. 4, available at www.jneurosci.org as supplemental material) were tracked to measure their velocity. Shown is the distribution of SG velocities in control cells (CTRL, 112 granules from 7 cells) or in MyoVa tail-expressing cells (MyoVa tail, 126 granules from 9 cells). The distribution is shifted to the right by MyoVa tail. *p < 0.05; **p < 0.01; ***p < 0.001.
Figure 5.
Figure 5.
Behavior of SGs before fusion. A, B, BON cells were cotransfected with pNPY-mRFP and an empty vector (CTRL) (A) or pEGFP-MyoVa-tail (MyoVa tail) (B). Two days after transfection, they were stimulated to secrete by UV flash photolysis of caged calcium and imaged by TIRFM at 10 Hz. Exocytotic events were detected by visual inspection of image stacks. SGs that underwent exocytosis were tracked, and their diffusion coefficient Dxy was measured as a function of time. Times shown are relative to the fusion event (arrowhead). Several granules remained almost immobile during the 10 s sequence, as indicated by their very low Dxy. Others were highly mobile and then suddenly stopped moving ∼2 s before fusion. The two-dimensional trajectory corresponding to the curve depicted by an arrow in A is shown in the inset and shows this transition from an apparently directed motion (in gray) to a docking period (in black). The end of the trajectory is depicted with a filled circle. Scale bar: Inset, 0.1 μm. Note that, whereas the majority of SGs that fuse in A were almost immobile during the whole sequence, this was not the case in B. The reduced number of stably docked SGs may account for the inhibitory effect of MyoVa tail on exocytosis (Table 1). C, Autocorrelation functions of z-motion have a negative component during docking periods. Docking periods (Dxy < 5 × 10⁻⁴ μm2/s) were detected using a rolling window to calculate Dxy along SG trajectories from CTRL cells. The relative motion of SGs in the z-axis orthogonal to the plasma membrane was calculated and the time sequence of Δz displacements was autocorrelated (see Materials and Methods). Shown is G(τ) ± SEM measured in CTRL cells for docking periods. The negative component of G(τ) at short τ reflects the tendency of SGs to reverse their direction, an indicator of caging or tethering.
Figure 6.
Figure 6.
MyoVa silencing decreases the frequency of long-lasting immobilization periods. BON cells were treated with control siRNAs (CTRL, 20 cells; filled bars) or with MyoVa targeting siRNAs (MyoVa RNAi, 20 cells; open bars) as described in Figure 4. A rolling window of 2.5 s was used to calculate Dxy along SG trajectories and to determine docking periods (Dxy < 5 × 10⁻⁴ μm2/s). Shown is the probability that, at any given time point of its trajectory, a SG experienced a docking period of a given duration (snapshot occurrence) (see Materials and Methods). Errors are given as the mean ± SE of 20 cells. ***p < 0.001.

References

    1. Ali MY, Krementsova EB, Kennedy GG, Mahaffy R, Pollard TD, Trybus KM, Warshaw DM. From the cover: myosin Va maneuvers through actin intersections and diffuses along microtubules. Proc Natl Acad Sci USA. 2007;104:4332–4336. - PMC - PubMed
    1. Allersma MW, Bittner MA, Axelrod D, Holz RW. Motion matters: secretory granule motion adjacent to the plasma membrane and exocytosis. Mol Biol Cell. 2006;17:2424–2438. - PMC - PubMed
    1. Axelrod D. Cell-substrate contacts illuminated by total internal reflection fluorescence. J Cell Biol. 1981;89:141–145. - PMC - PubMed
    1. Darcy KJ, Staras K, Collinson LM, Goda Y. Constitutive sharing of recycling synaptic vesicles between presynaptic boutons. Nat Neurosci. 2006;9:315–321. - PubMed
    1. Desnos C, Schonn JS, Huet S, Tran VS, El-Amraoui A, Raposo G, Fanget I, Chapuis C, Menasche G, De Saint Basile G, Petit C, Cribier S, Henry JP, Darchen F. Rab27A and its effector MyRIP link secretory granules to F-actin and control their motion towards release sites. J Cell Biol. 2003;163:559–570. - PMC - PubMed

Publication types

LinkOut - more resources