. 2007 Oct;48(10):4785-94.
doi: 10.1167/iovs.07-0343.

Prevention of excitotoxicity in primary retinal ganglion cells by (+)-pentazocine, a sigma receptor-1 specific ligand

Affiliations

Prevention of excitotoxicity in primary retinal ganglion cells by (+)-pentazocine, a sigma receptor-1 specific ligand

Ying Dun et al. Invest Ophthalmol Vis Sci. 2007 Oct.

Abstract

Purpose: Sigma receptors (sigmaRs) are nonopioid, nonphencyclidine binding sites with robust neuroprotective properties. Previously, the authors induced death in the RGC-5 cell line using very high concentrations (1 mM) of the excitatory amino acids glutamate (Glu) and homocysteine (Hcy) and demonstrated that the sigmaR1 ligand (+)-pentazocine ((+)-PTZ) could protect against cell death. The purpose of the present study was to establish a physiologically relevant paradigm for testing the neuroprotective effect of (+)-PTZ in retinal ganglion cells (RGCs).

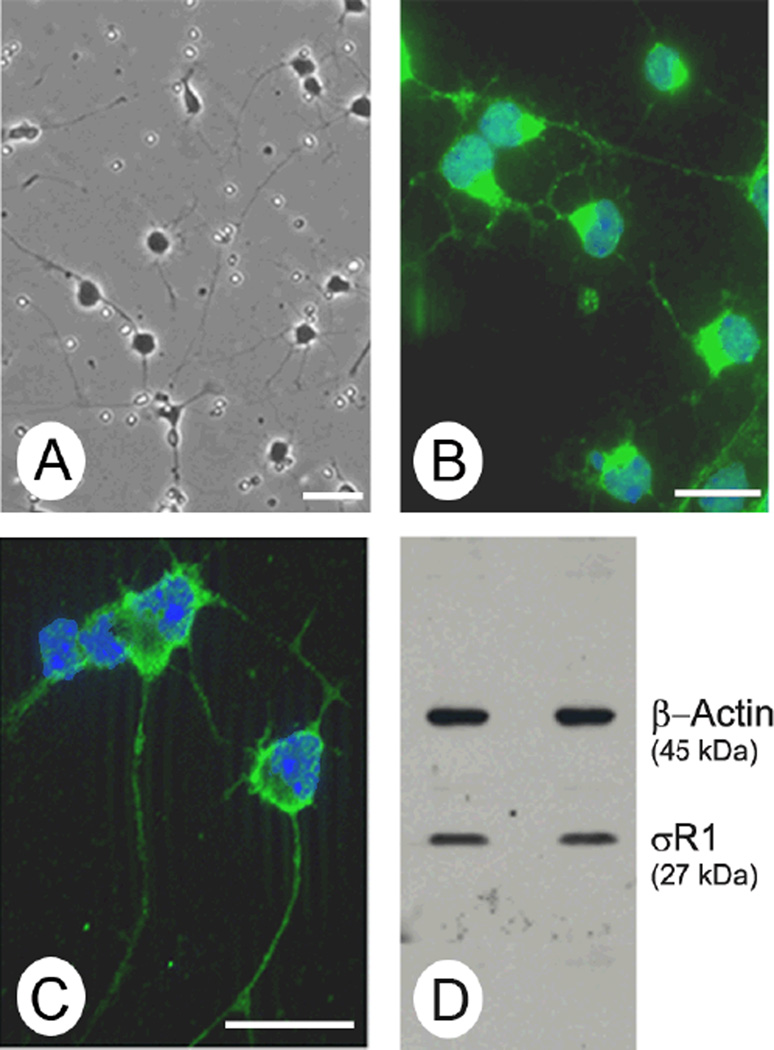
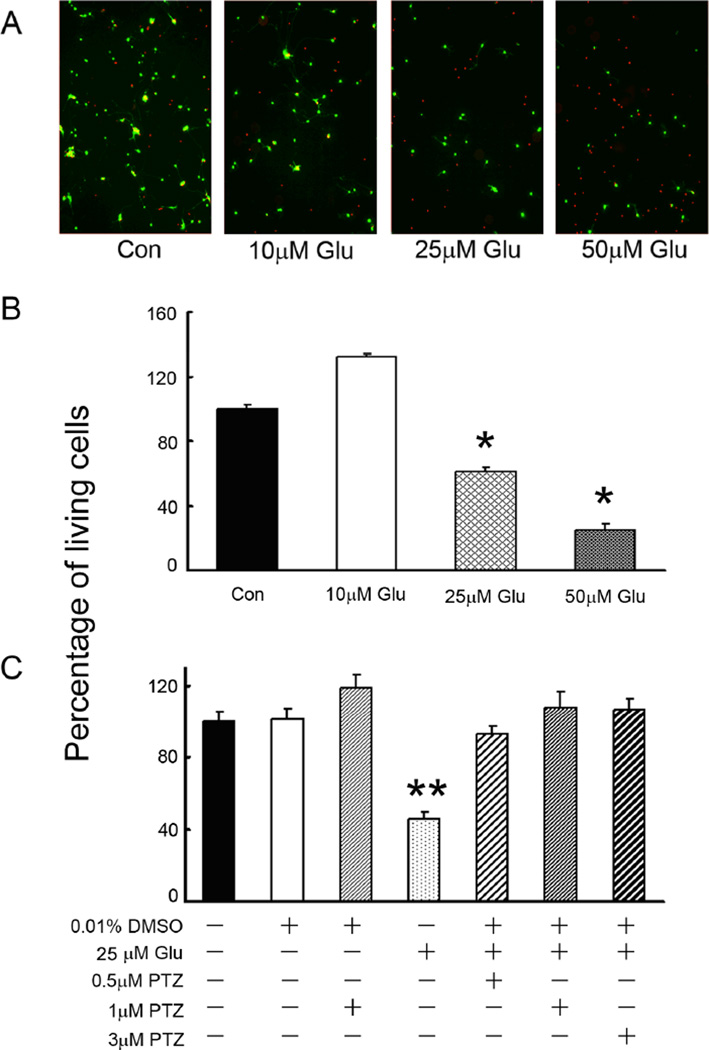
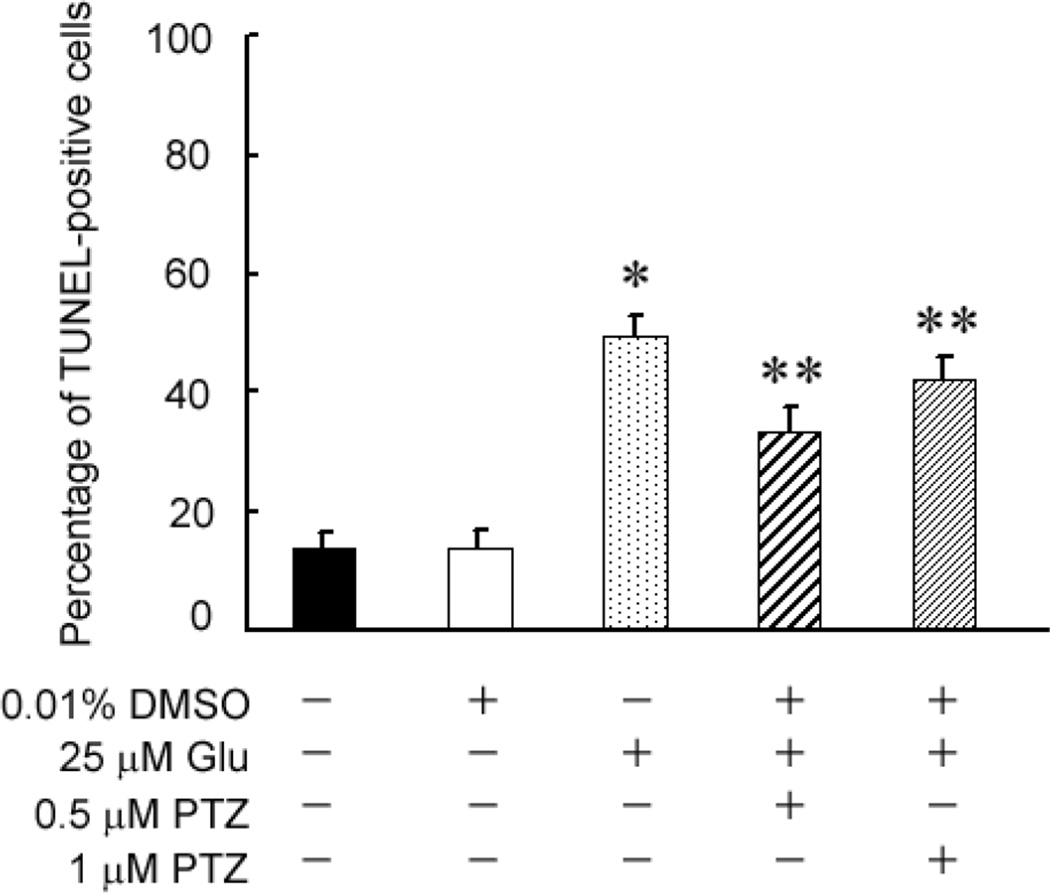
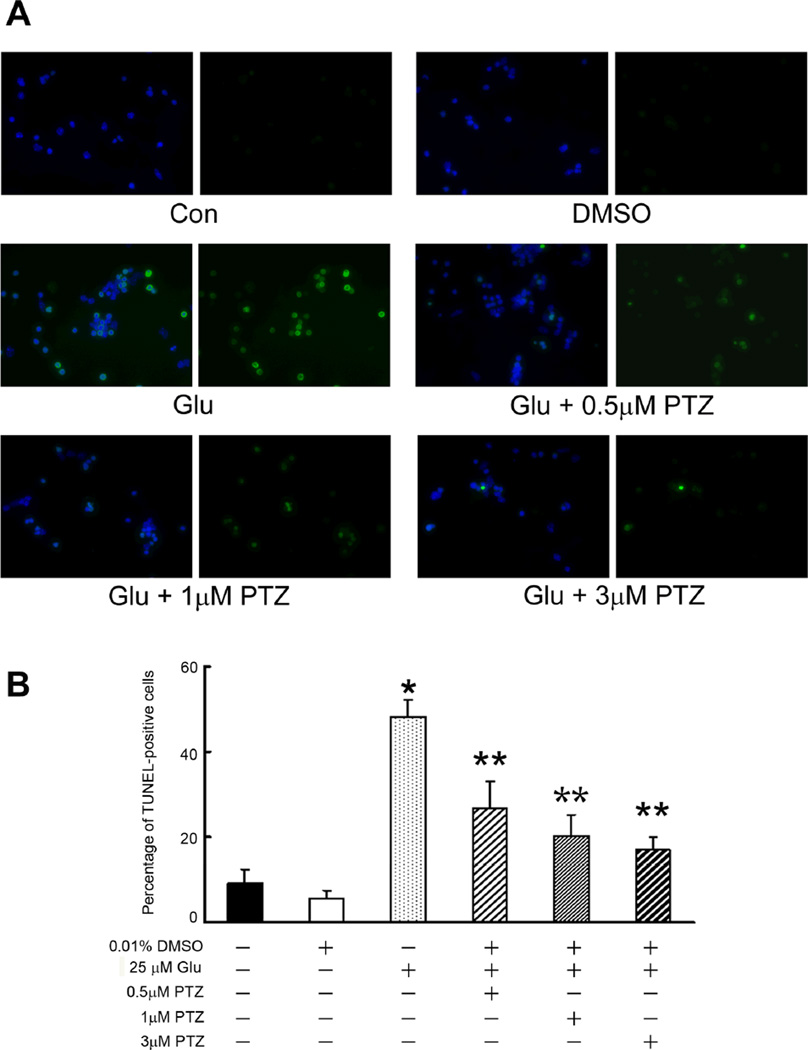
Methods: Primary ganglion cells (GCs) were isolated by immunopanning from retinas of 1-day-old mice, maintained in culture for 3 days, and exposed to 10, 20, 25, or 50 microM Glu or 10, 25, 50, or 100 microM Hcy for 6 or 18 hours in the presence or absence of (+)-PTZ (0.5, 1, 3 microM). Cell viability was measured using the viability and apoptosis detection fluorescein in situ assays. Expression of sigmaR1 was assessed by immunocytochemistry, RT-PCR, and Western blotting. Morphologic appearance of live ganglion cells and their processes was examined over time (0, 3, 6, 18 hours) by differential interference contrast (DIC) microscopy after exposure to excitotoxins in the presence or absence of (+)-PTZ.

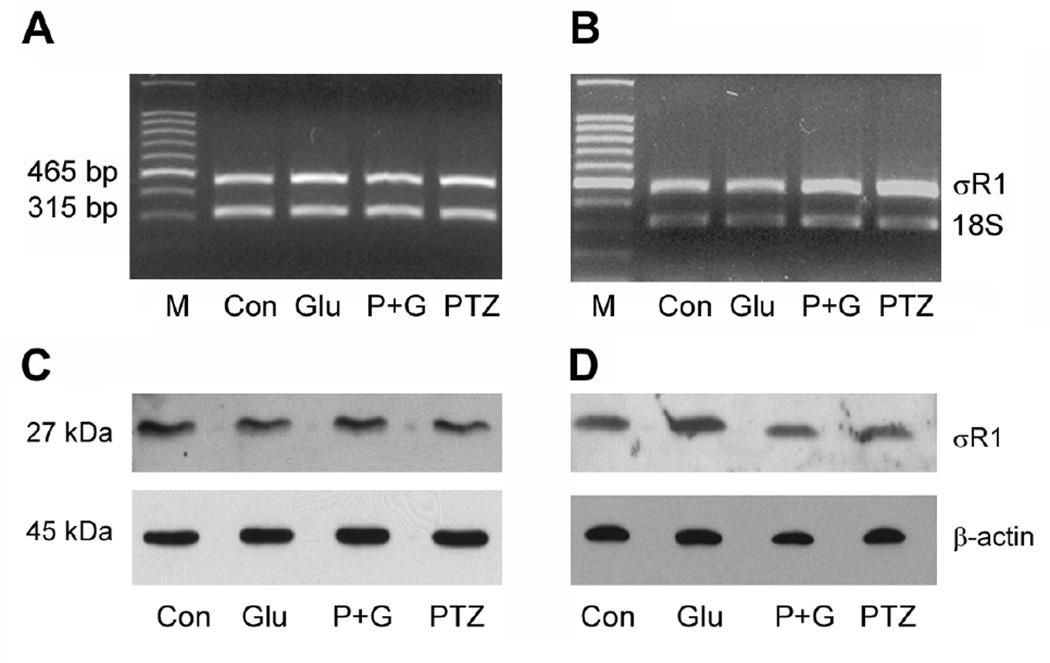
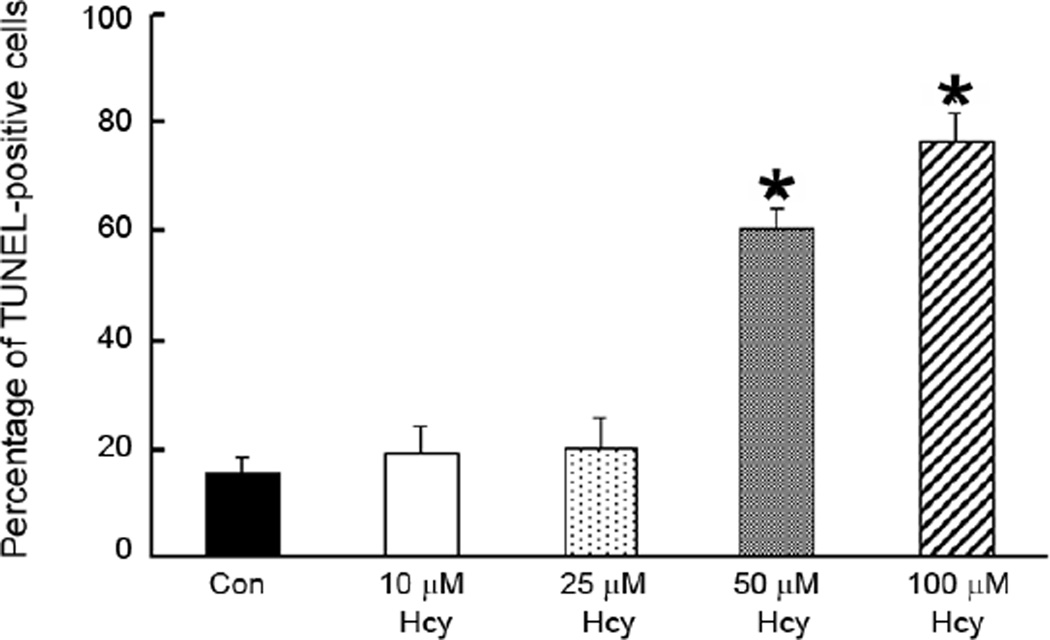
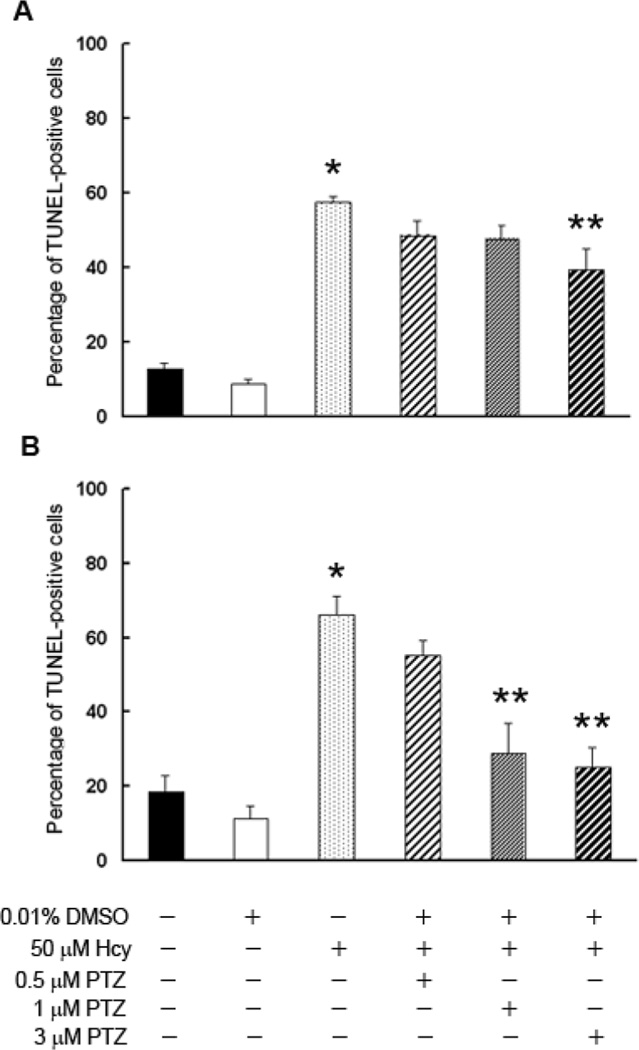
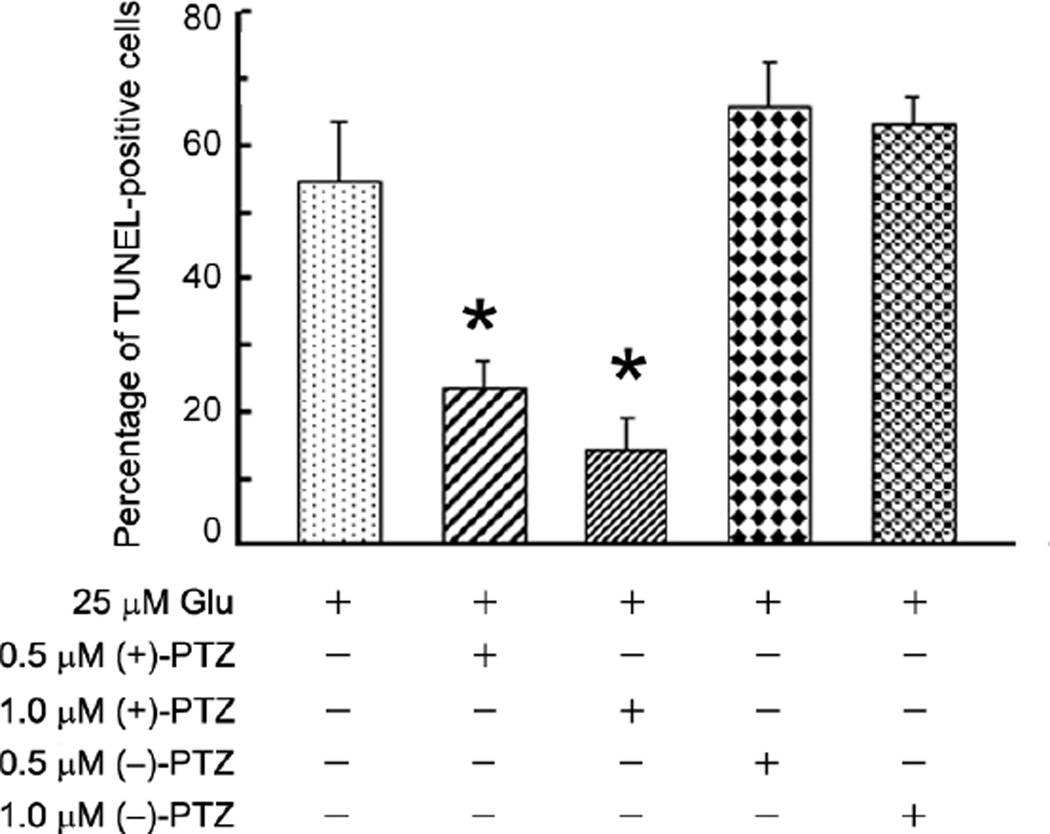
Results: Primary GCs showed robust sigmaR1 expression. The cells were exquisitely sensitive to Glu or Hcy toxicity (6-hour treatment with 25 or 50 microM Glu or 50 or 100 microM Hcy induced marked cell death). Primary GCs pretreated for 1 hour with (+)-PTZ followed by 18-hour cotreatment with 25 microM Glu and (+)-PTZ showed a marked decrease in cell death: 25 microM Glu alone, 50%; 25 microM Glu/0.5 microM (+)-PTZ, 38%; 25 microM Glu/1 microM (+)-PTZ, 20%; 25 microM Glu/3 microM (+)-PTZ, 18%. Similar results were obtained with Hcy. sigmaR1 mRNA and protein levels did not change in the presence of the excitotoxins. DIC examination of cells exposed to excitotoxins revealed substantial disruption of neuronal processes; cotreatment with (+)-PTZ revealed marked preservation of these processes. The stereoselective effect of (+)-PTZ for sigmaR1 was established in experiments in which (-)-PTZ, the levo-isomer form of pentazocine, had no neuroprotective effect on excitotoxin-induced ganglion cell death.

Conclusions: Primary GCs express sigmaR1; their marked sensitivity to Glu and Hcy toxicity mimics the sensitivity observed in vivo, making them a highly relevant model for testing neuroprotection. Pretreatment of cells with 1 to 3 microM (+)-PTZ, but not (-)-PTZ, affords significant protection against Glu- and Hcy-induced cell death. sigmaR1 ligands may be useful therapeutic agents in retinal diseases in which ganglion cells die.


Figures

Fig. 1
Fig. 1. Detection of σR1 in 1°GCs isolated from mouse retina
(A). Phase contrast images of primary mouse retinal ganglion cells (1°GCs) after 3 days in culture. The cells have long processes extending from the variably sized cell bodies, which are characteristics of ganglion cells. (B). Immunolabeling of 1°GCs with an antibody against NF-160, a neuronal marker detected with Alexafluor 488 (green), nuclei stained with DAPI (blue). (C). Immunolabeling of 1°GCs with an affinity-purified polyclonal antibody against σR1, detected with Alexafluor 488 (green), nuclei stained with DAPI (blue). (D). Two separate preparations (left and right lanes) of 1°GCs used for immunoblotting with an affinity-purified antibody against σR1 (Mr ~27 kDa) and an antibody against β-actin (Mr ~45 kDa, internal loading control). (Magnification bar = 15 µm)
Fig. 2
Fig. 2. Neuroprotective effect of (+)-PTZ on glutamate (Glu)-induced 1°GC death
(A) Photomicrographs of the live/dead assay in 1°GCs exposed 6 h to Neurobasal medium with no additional Glu (control) or to Neurobasal containing 10 µM, 25 µM and 50 µM Glu. Living cells fluoresce green; dead cells fluoresce red. (B) Quantitation of live 1°GCs following exposure to Glu (10, 25 and 50 µM) for 6 h, (*, significantly different from control and 10 µM Glu, p<0.001); (C) 1°GCs were pretreated with (+)-PTZ (0.5, 1, 3 µM) for 1 h and then co-exposed to 25 µM Glu and (+)-PTZ (0.5, 1, 3 µM) for an additional 16 h. Cells were subjected to the live/dead assay to determine viability. (**, significantly different from control cells (not treated with Glu) and from cells exposed to Glu and (+)-PTZ, p<0.001). Data in panels B and C are expressed as the mean and S.E. of the ratio of living cells to the total number of cells; data were normalized to the control value which was considered 100%, n = 10
Fig. 3
Fig. 3. Assessment of the number of TUNEL-positive 1°GCs following 6 h incubation with Glu in the absence or presence of (+)-pentazocine ((+)-PTZ)
1°GCs were pre-treated for 1 h with or without (+)-PTZ (0.5 or 1 µM) followed by co-incubation for 6 h with Glu (25 µM) and (+)-PTZ (0.5 or 1 µM); the number of TUNEL-positive cells was determined using the ApopTag fluorescein method. Data are expressed as the mean and S.E. of the ratio of dead/dying (TUNEL-positive) cells to the total number of cells, n = 10 (*, significantly different from untreated control or vehicle (DMSO) control at p<0.001; **, significantly different from treatment with 25 µM Glu alone (without (+)-(+)-PTZ)).
Fig. 4
Fig. 4. Assessment of the number of TUNEL-positive 1°GCs when pretreated with (+)-PTZ and then co-incubated 18 h with Glu and (+)-PTZ
(A) Representative photomicrographs showing results of the TUNEL assay. Cells that fluoresce green are TUNEL-positive indicative of apoptosis. All samples were labeled also with DAPI (blue) to stain nuclei. For each pair of photomicrographs, the left image shows the merged (DAPI plus TUNEL staining) and the right image shows only the TUNEL staining. From above downward, the top panels show representative images of cells that received no Glu exposure (control, DMSO vehicle control); the middle panel (Glu) shows marked increase in TUNEL-positive cells following 18 h exposure to 25 µM glutamate. The remaining three panels show fewer TUNEL-positive cells when pre-treated and co-incubated with (+)-PTZ (0.5, 1 or 3 µM). (B) Quantification of the data from TUNEL analysis shown in panel A. The number of TUNEL-positive cells was determined per 100 cells counted. Data are expressed as the mean and S.E. of the ratio of dead/dying cells to the total number of cells, n = 10 (*, significantly different from control, p<0.001; **, significantly different from treatment with 25 µM Glu alone (without (+)-(+)-PTZ)).
Fig. 5
Fig. 5. σR1 mRNA and protein levels in 1°GC following treatment with Glu and (+)-PTZ
1°GCs were incubated for 6 h (A & C) or 18 h (B & D) in the absence or presence of 25 µM Glu and the absence or presence of 3 µM (+)-PTZ. A and B: total RNA was isolated and used for semiquantitative RT-PCR. Primer pairs specific for mouse σR1 mRNA (465 bp) were used. 18S RNA (315 bp) was analyzed in the same RNA samples as the internal control. RT-PCR products were run on a gel and stained with ethidium bromide. C and D: Proteins were extracted from cells and subjected to SDS-PAGE, followed by immunoblotting using an affinity purified antibody against σR1, Mr ~27 kDa or β-actin, Mr ~45 kDa (internal loading control). (M, DNA marker; Con, control; Glu, 25 µM glutamate-treated cells; P + G, (+)-PTZ 3 µM plus 25 µM glutamate; (+)-PTZ, 3 µM (+)-PTZ incubation alone).
Fig. 6
Fig. 6. Dose-dependent increase in TUNEL-positive 1°GCs following exposure to homocysteine (Hcy)
The number of TUNEL-positive cells was determined using the ApopTag fluorescein method in 1°GCs exposed to Hcy (10, 25, 50 and 100 µM) for 6 h. Data are expressed as the mean and S.E. of the ratio of dead/dying cells to the total number of cells, n = 10. (*, significantly different from control, p <0.001).
Fig. 7
Fig. 7. Assessment of the number of TUNEL-positive 1°GCs following 6 or 18 h incubation with homocysteine (Hcy) and (+)-PTZ
1°GCs were pre-treated for 1 h with (+)-PTZ (0.5, 1 or 3 µM) followed by co-incubation for 6 h (A) or 18 h (B) with Hcy (50 µM) and (+)-PTZ (0.5, 1 or 3 µM). The number of TUNEL-positive cells was determined using the ApopTag fluorescein method. Data are expressed as the mean and S.E. of the ratio of dead/dying cells to the total number of cells, n = 10. (*, significantly different from control, p <0.001; **, significantly different from cells treated with 50 µM Hcy, p<0.001).
Fig. 8
Fig. 8. Differential interference contrast microscopic analysis of cells exposed to Glu or homocysteine (Hcy) and (+)-PTZ
1°GCs were isolated and cultured as described. Control cells (Con) were not exposed to excitotoxins; the row of photographs labeled “Glu” shows cells that were incubated with 25 µM Glu over a period of 18 h; photomicrographs were acquired at 0, 3, 6, 18 h post-incubation. The row of photographs labeled “Hcy” shows cells that were incubated with 50 µM Hcy over an 18 h period and photographed at 0, 3, 6 and 18 h post-incubation. In additional experiments, cells were pretreated with (+)-PTZ for 1 h and then co-incubated with (+)-PTZ and the excitotoxin for 18 h. Cell bodies and processes of cells co-treated with either Glu or Hcy and (+)-PTZ were similar in appearance to control cells. In the top left panel (control, 0 time) the arrow points to a process extending from the cell body. (Magnification bar = 15 µm). All photomicrographs are the same magnification.
Fig. 9
Fig. 9. Assessment of the number of TUNEL-positive 1°GCs pretreated with either (+)-PTZ or (−)-PTZ followed by 18 h co- incubation with Glu
1°GCs were incubated 1 h with (+)-PTZ or (−)-PTZ (0.5, 1.0 µM) followed by co-incubation with PTZ and 25 µM Glu for 18 h. TUNEL-positive cells were determined using the ApopTag kit. The number of TUNEL-positive cells was determined per 100 cells counted. Data are expressed as the mean and S.E. of the ratio of dead/dying cells to the total number of cells, n = 10 (*, significantly different from treatment with 25 µM Glu alone, p<0.001).

References

    1. Hayashi T, Su TP. Sigma-1 receptor ligands: potential in the treatment of neuropsychiatric disorders. CNS Drugs. 2004;18:269–284. - PubMed
    1. Quirion R, Bowen WD, Itzhak JL, et al. A proposal for the classification of sigma binding sites. Trends Pharmacol. Sci. 1992;13:85–86. - PubMed
    1. Hanner M, Moebius FF, Flandorfer A, et al. Purification, molecular cloning, and expression of the mammalian sigma 1-binding site. Proc. Natl. Acad. Sci. USA. 1996;93:8072–8077. - PMC - PubMed
    1. Kekuda R, Prasad PD, Fei YJ, et al. Cloning and functional expression of the human type 1 sigma receptor (hSigmaR1) Biochem. Biophys. Res. Commun. 1996;229:553–558. - PubMed
    1. Prasad PD, Li HW, Fei YJ, et al. Exon-intron structure, analysis of promoter region, and chromosomal localization of the human type 1 sigma receptor gene. J. Neurochem. 1998;70:443–451. - PubMed

Publication types

MeSH terms