. 2007 Oct;48(10):4818-28.
doi: 10.1167/iovs.07-0218.

Effects of Spectral Characteristics of Ganzfeld Stimuli on the Photopic Negative Response (PhNR) of the ERG

Affiliations

Effects of Spectral Characteristics of Ganzfeld Stimuli on the Photopic Negative Response (PhNR) of the ERG

Nalini V Rangaswamy et al. Invest Ophthalmol Vis Sci. 2007 Oct.

Abstract

Purpose: To determine flash and background colors that best isolate the photopic negative response (PhNR) and maximize its amplitude in the primate ERG.

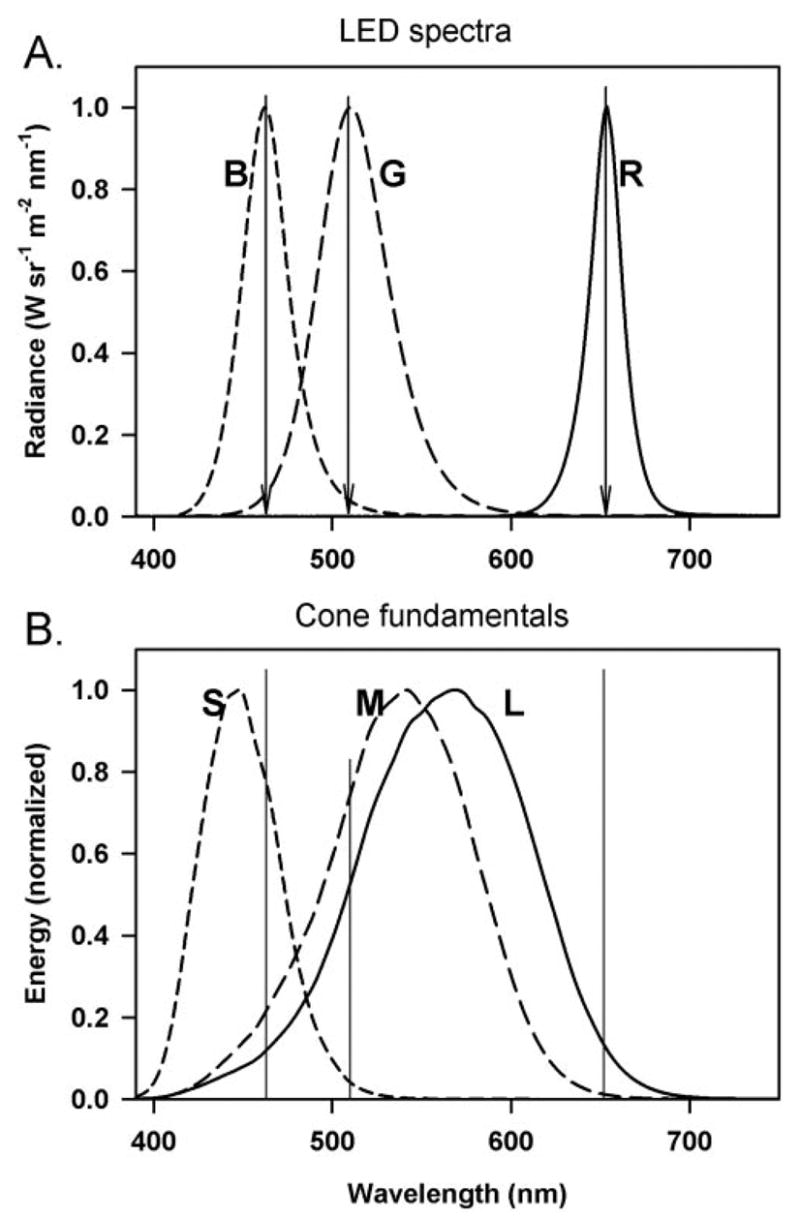
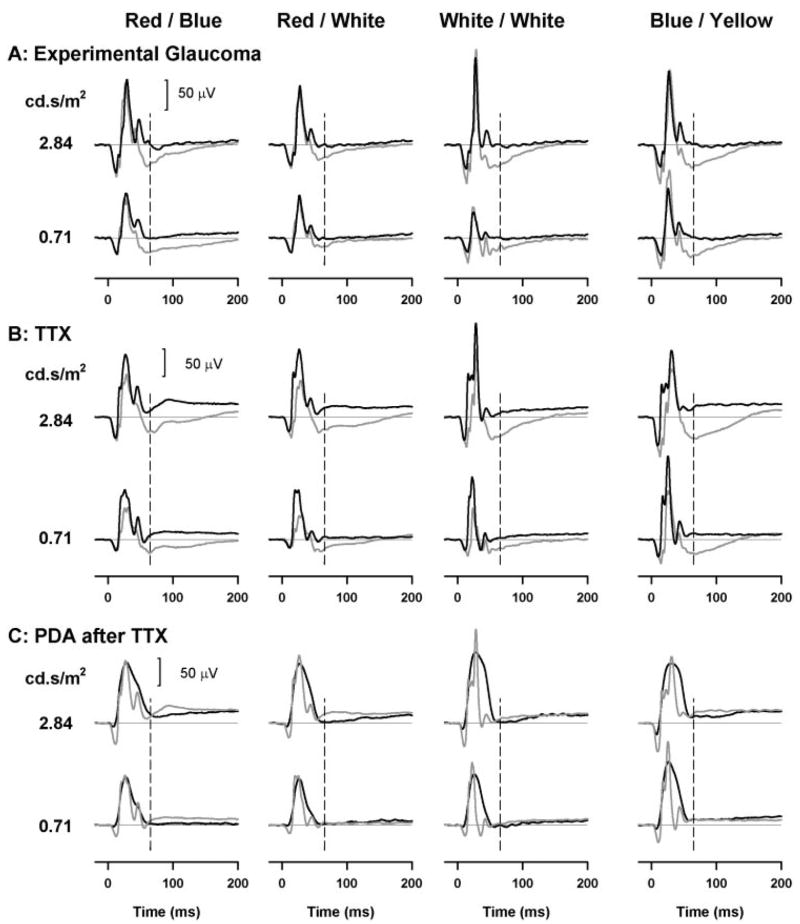
Methods: Photopic full-field flash ERGs were recorded from anesthetized macaque monkeys before and after pharmacologic blockade of Na(+)-dependent spiking activity with tetrodotoxin (TTX, 1 to 2 muM, n = 3), blockade of ionotropic glutamatergic transmission with cis-2,3 piperidine dicarboxylic acid (PDA, 3.3-3.8 mM, n = 3) or laser-induced monocular experimental glaucoma (n = 6), and from six normal human subjects. Photopically matched colored flashes of increasing stimulus strengths were presented on scotopically matched blue, white, or yellow backgrounds of 100 scot cd/m(2) using an LED-based stimulator.

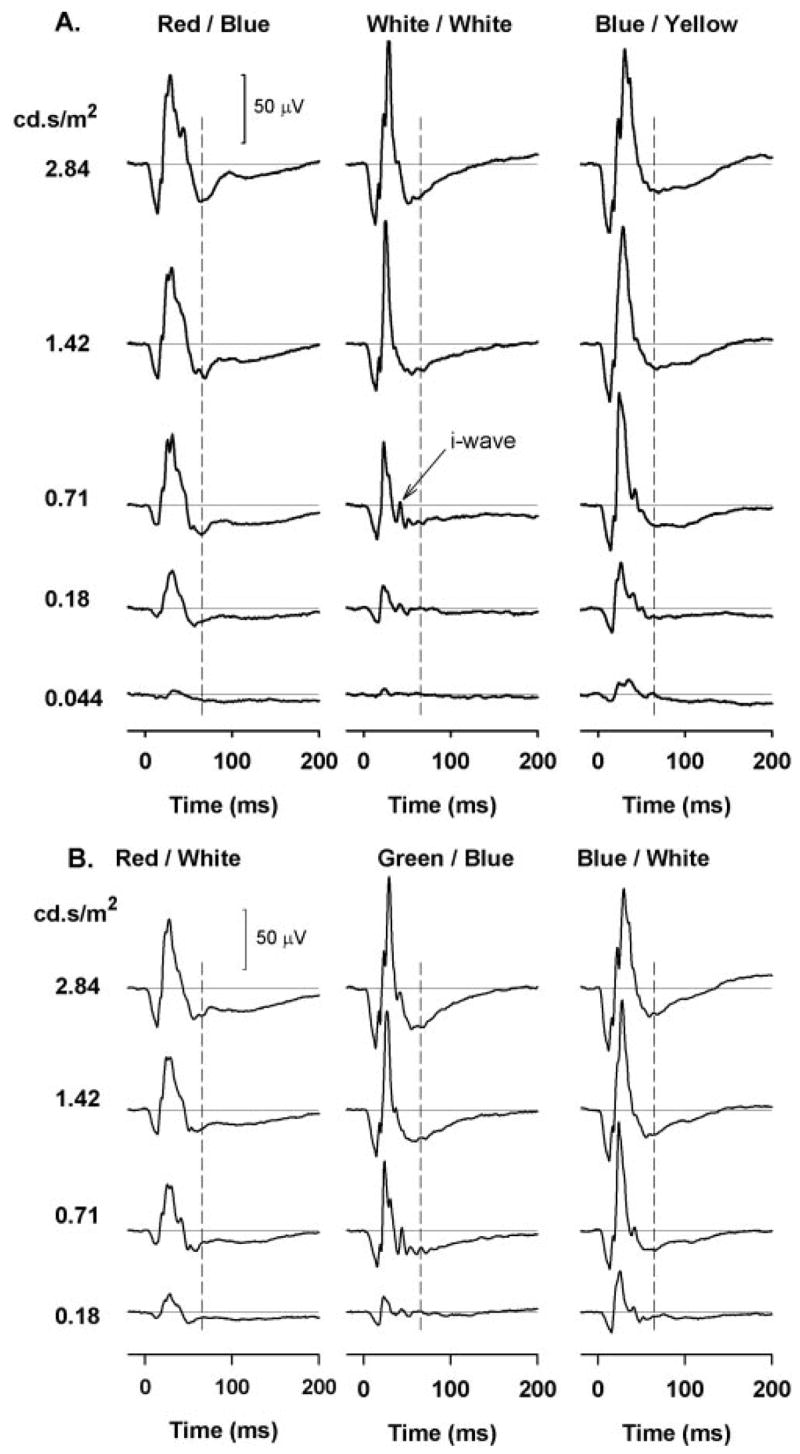
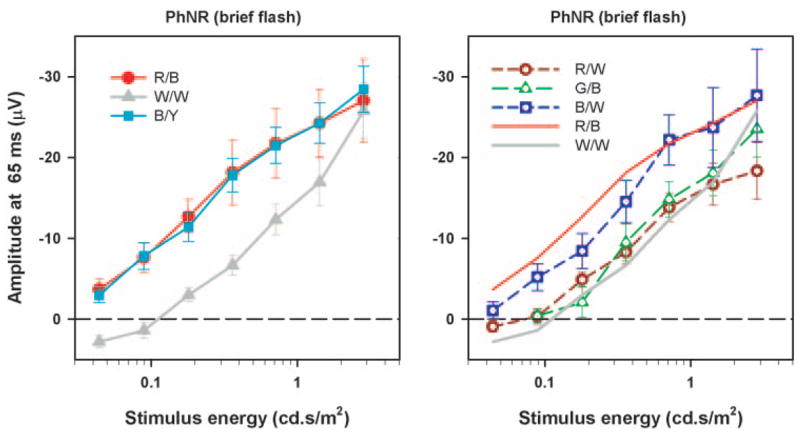
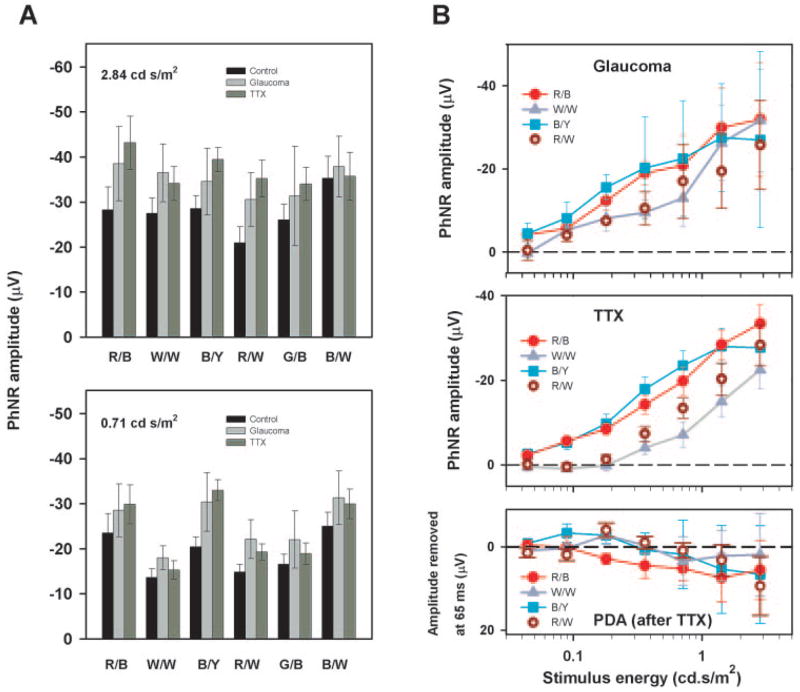
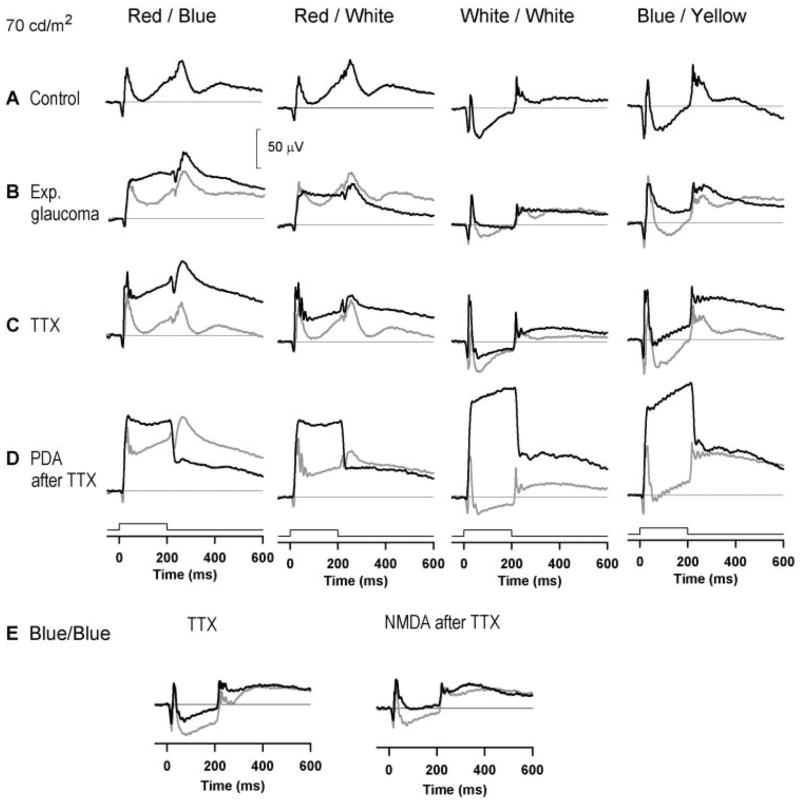
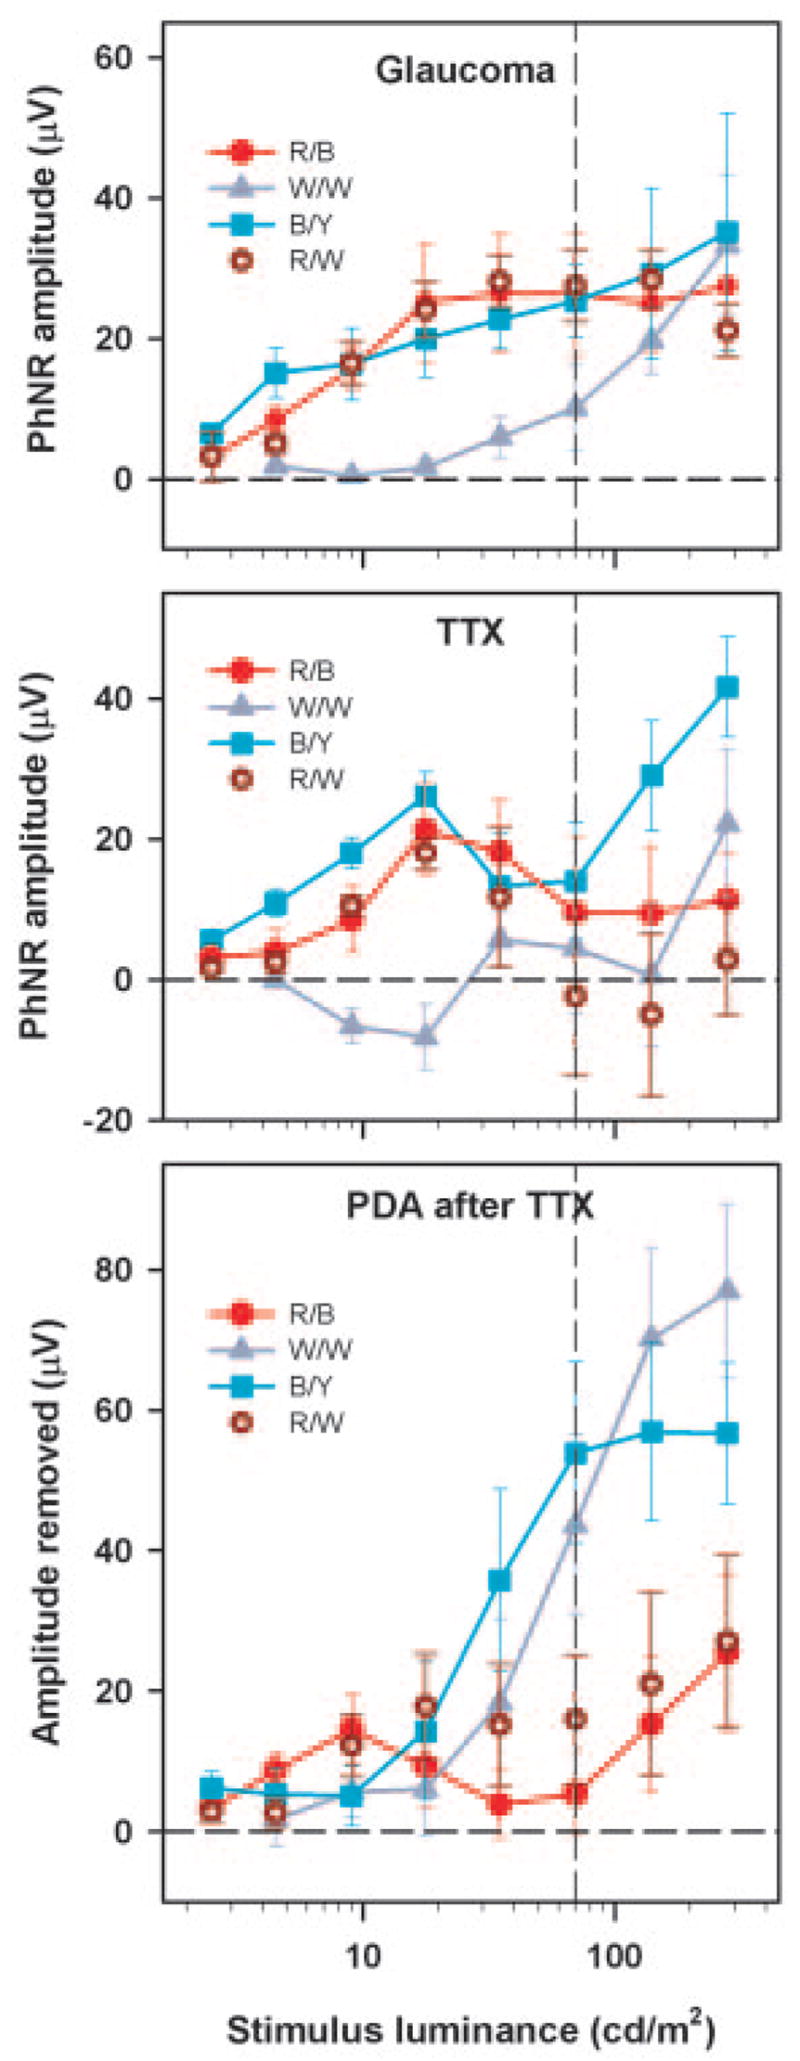
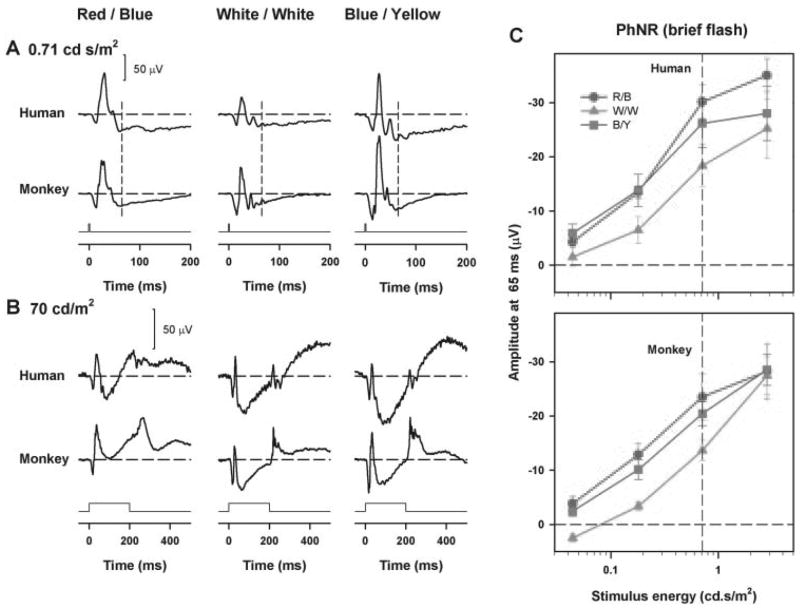
Results: PhNRs that could be eliminated by TTX or severe experimental glaucoma were present in responses to brief (<5 ms) and long-duration (200 ms) stimuli of all color combinations. In normal monkey and human eyes for brief low-energy flashes, PhNR amplitudes were highest for red flashes on blue backgrounds and blue flashes on yellow backgrounds. For high-energy flashes, amplitudes were more similar for all color combinations. For long-duration stimuli, the PhNR(on) at light onset in monkeys was larger for red and blue stimuli, regardless of background color, than for spectrally broader flashes, except for stimuli >17.7 cd/m(2) when PhNR(on)s were all of similar amplitude. For red flashes, eliminating the PhNR(on) pharmacologically or by glaucoma removed the slowly recovering negative wave that normally followed the transient b-wave and elevated the whole ON response close to the level of the b-wave peak. However, for white, blue, and green flashes, a lower-amplitude plateau that could be removed by PDA remained.

Conclusions: For weak to moderate flash strengths, the best stimulus for maximizing PhNR amplitude is one that primarily stimulates one cone type, on a background with minimal adaptive effect on cones. For stronger stimuli, differences in amplitude are smaller. For long-duration stimuli, red best isolates the PhNR(on) because it minimizes the overlapping lower-level plateau that originates from the activity of second-order hyperpolarizing retinal neurons.


Figures

Figure 1
Figure 1
(A) Spectrum of the three LEDs (blue, green, and red) of the stimulator (Espion ColorBurst, Diagnosys LLC, Lowell, MA). (B) Cone fundamentals of the three human cones (S, M, and L) for a 10° field (from Stockman et al.25). The vertical lines in (B) correspond to the peak wavelength of the LEDs denoted by arrows in (A).
Figure 2
Figure 2
(A) Photopic full-field flash ERGs obtained with (left) brief red flashes on a blue background, (middle) white flashes on a white background, and (right) blue flashes on a yellow background for the range of stimulus strengths used in this study from a control monkey eye. (B) Photopic full-field flash ERGs obtained, left to right: with red on white, green on blue, and blue on white for four stimulus strengths from the same control eye as shown in (A).
Figure 3
Figure 3
Mean PhNR amplitude (measured from the baseline at 65 ms) as a function of stimulus energy (left) for red on blue, for white on white, and for blue on yellow and (right) for red on white, green on blue, and blue on white. The error bars are ± 1 SEM (n = 6).
Figure 4
Figure 4
Photopic full-field flash ERGs with brief flashes obtained before (gray trace) and after experimental glaucoma (black trace) (A), TTX (black traces) (B), and PDA after TTX (black traces). The ERGs after TTX are shown as a solid gray line (C) for two stimulus energies (0.71 and 2.84 cd-s/m2).
Figure 5
Figure 5
(A) Glaucoma (n = 6) and TTX sensitive (n = 3) portion of the response measured at 65 ms after the flash with the different colors for two stimulus energies: 2.84 cd.s/m2 (top) and 0.71 cd.s/m2 (bottom). The PhNR amplitude of the control eye was measured from the baseline for each color combination. (B) Glaucoma (top), and TTX (middle), and PDA after TTX sensitive portion (bottom) (all n = 3) of the response measured at 65 ms after the flash as a function of stimulus energy for red on blue (R/B), white on white (W/W), blue on yellow (B/Y), and red on white (R/W). The error bars represent ±1 SEM. The control for the glaucomatous eye was the normotensive fellow eye and the control for eyes treated with test agents was the pretreatment measure in the same eye.
Figure 6
Figure 6
Photopic full-field flash ERGs obtained with long-duration (200 ms) flashes for the different colors shown for a stimulus luminance of 70 cd/m2 from a control monkey eye (black line) (A); experimental glaucoma (black line; control is shown by the gray line) (B); TTX (black line) (C); and PDA after TTX (black line). The ERGs after TTX are shown by the gray line (D); the effect of TTX (left, 1.1 μM; black line) and NMDA (1.6 mM) after TTX on a long-duration flash response recorded with a blue flash on a blue background for the same flash and background luminance as used in (AD). The preinjection control response (left) and the ERG after TTX but before NMDA (right) are shown by the gray lines (E).
Figure 7
Figure 7
Top: experimental glaucoma (n = 6). Middle: TTX-sensitive PhNRon (n = 3) plotted as a function of the stimulus luminance for the different color combinations. Bottom: PDA (after TTX; n = 3)-sensitive portion of the On part of the long-duration flash ERG as a function of stimulus luminance for the different color combinations. Error bars: ±1 SEM. The vertical dashed line in these plots represents the stimulus luminance for which ERGs are shown in Figures 6 and 8.
Figure 8
Figure 8
Photopic full-field flash ERGs obtained for three flash and background color combinations from a control human eye (top) and control monkey eye (bottom) for (A) brief of stimulus energy 0.71 cd-s/m2 and (B) long-duration flashes of stimulus luminance 70 cd/m2. (C) Mean PhNR amplitude (measured from baseline at 65 ms) for a brief flash as a function of stimulus energy for the human (top) and monkey (bottom) controls. The error bars represent ± 1 SEM. (C) Vertical dashed line: the stimulus energy for which ERGs are shown in Figures 4 and 8A.

References

    1. Viswanathan S, Frishman LJ, Robson JG, Harwerth RS, Smith EL., III The photopic negative response of the macaque electroretinogram is reduced by experimental glaucoma. Invest Ophthalmol Vis Sci. 1999;40:1124–1136. - PubMed
    1. Frishman LJ, Shen FF, Du L, et al. The scotopic electroretinogram of macaque after retinal ganglion cell loss from experimental glaucoma. Invest Ophthalmol Vis Sci. 1996;37:125–141. - PubMed
    1. Hare WA, Ton H, Ruiz G, Feldmann B, Wijono M, WoldeMussie E. Characterization of retinal injury using ERG measures obtained with both conventional and multifocal methods in chronic ocular hypertensive primates. Invest Ophthalmol Vis Sci. 2001;42:127–136. - PubMed
    1. Bloomfield SA. Effect of spike blockade on the receptive field size of amacrine and ganglion cells in the rabbit retina. J Neurophysiol. 1996;75:1878–1893. - PubMed
    1. Stafford DK, Dacey DM. Physiology of the A1 amacrine: a spiking axon-bearing interneuron of the macaque monkey retina. Vis Neurosci. 1997;14:507–522. - PubMed

Publication types