. 2007 Oct;48(10):4854-60.
doi: 10.1167/iovs.07-0406.

Development of scotopic visual thresholds in retinopathy of prematurity

Affiliations

Development of scotopic visual thresholds in retinopathy of prematurity

Amber M Barnaby et al. Invest Ophthalmol Vis Sci. 2007 Oct.

Abstract

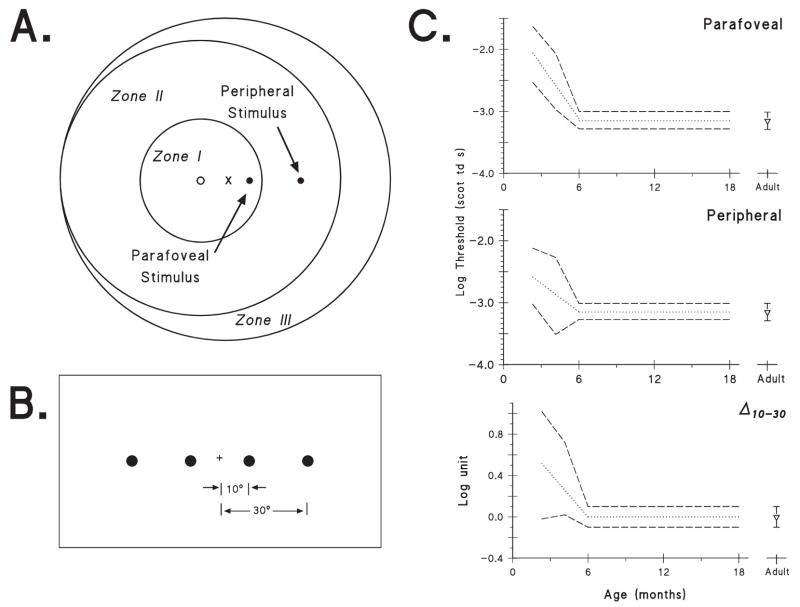
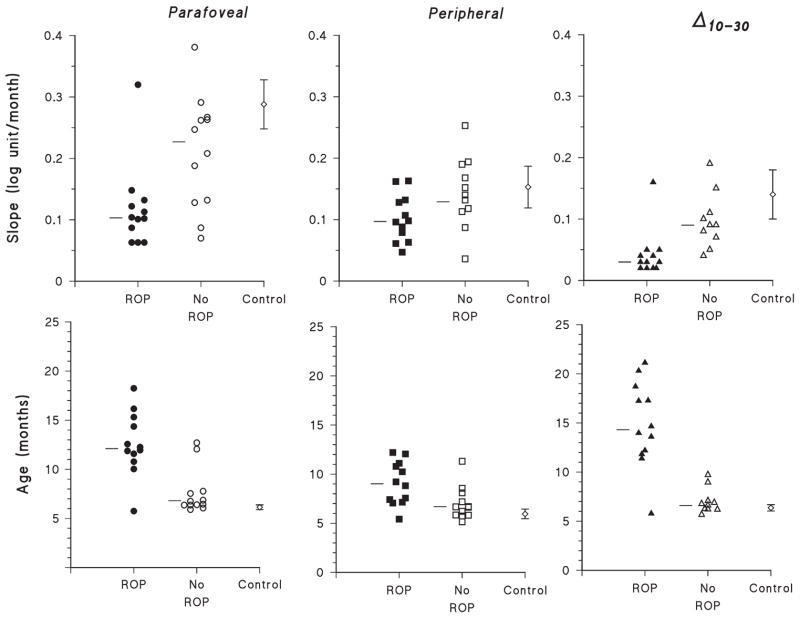
Purpose: To test the hypothesis that the late-maturing parafoveal rod photoreceptors are more vulnerable than peripheral rods to the effects of retinopathy of prematurity (ROP).

Methods: Twenty-four infants with a history of preterm birth (gestational age at birth </=31 weeks) participated in a longitudinal study: 12 had mild ROP that resolved without treatment, and 12 had never had ROP. Thresholds for detecting stimuli (2 degrees diameter, 50 ms duration) presented 10 degrees (parafoveal) and 30 degrees (peripheral) from a central fixation target were estimated by using a preferential-looking

Method: At each visit, thresholds at both sites were obtained in random order. Thresholds of the preterm subjects were compared with those of previously reported term infants.

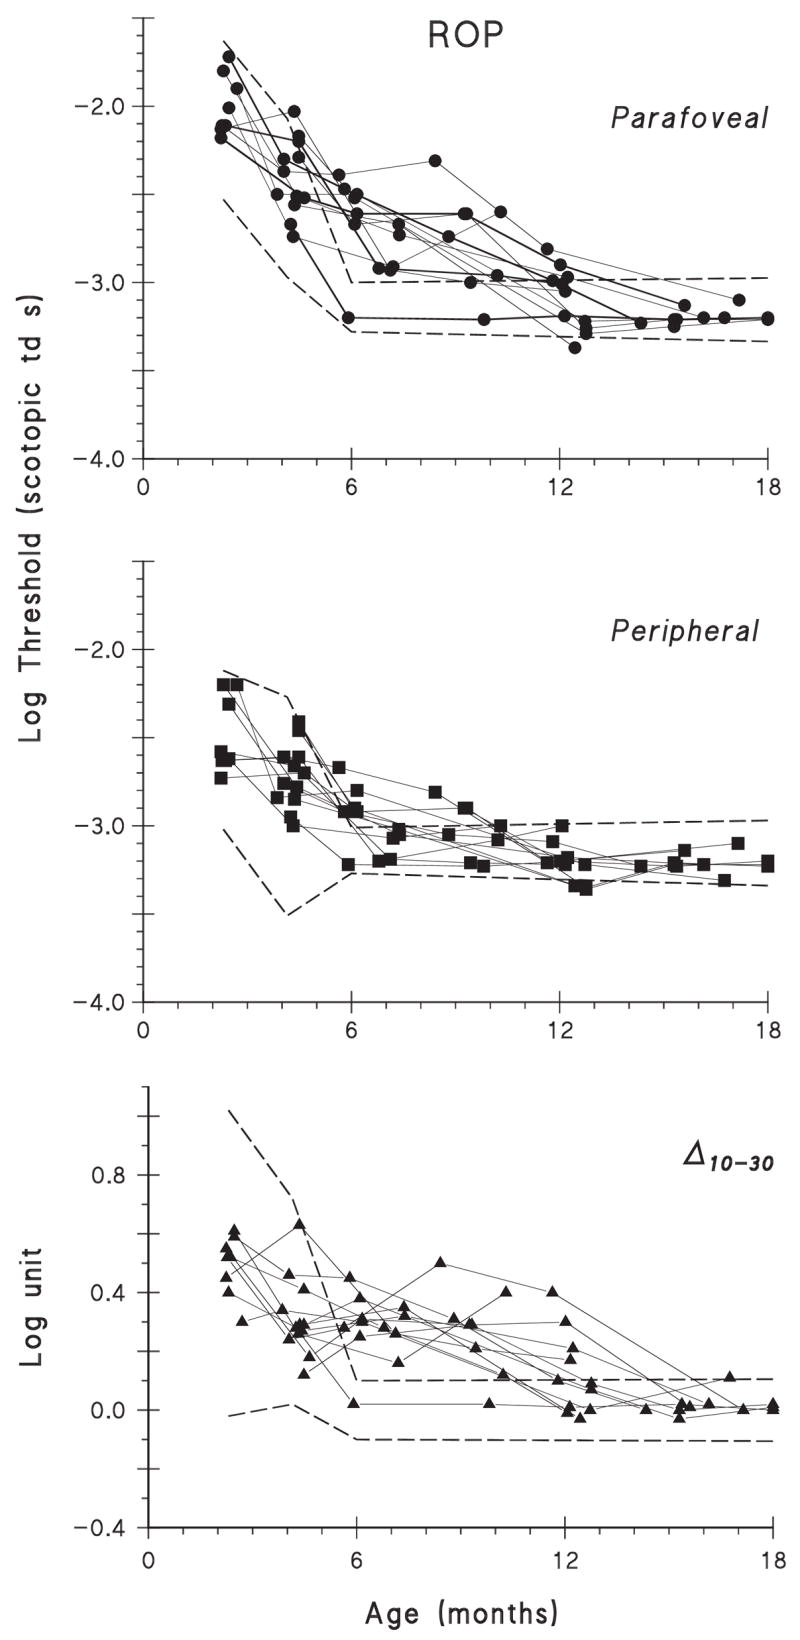
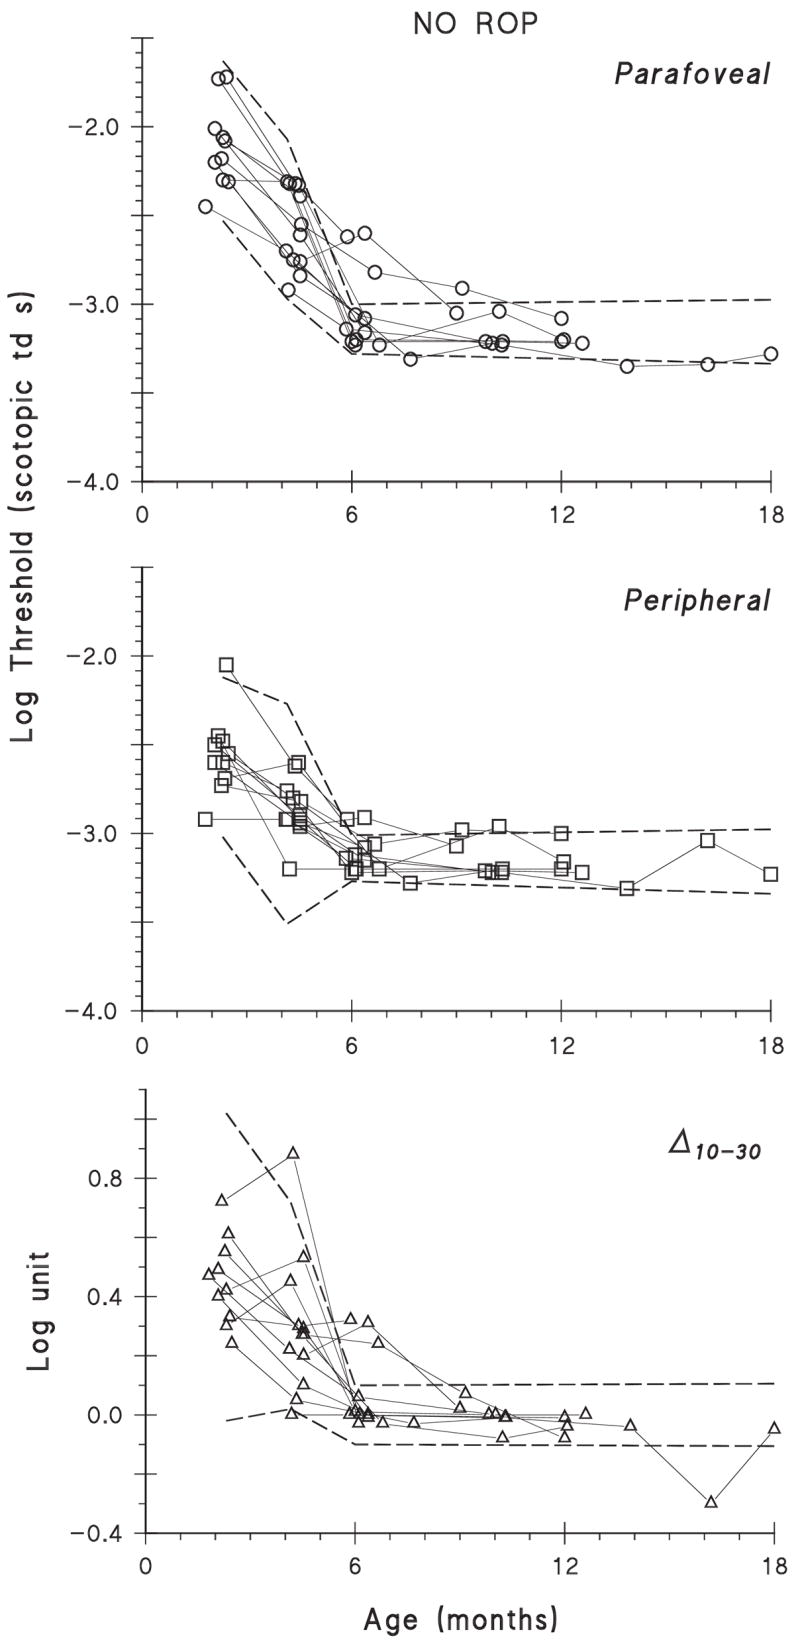
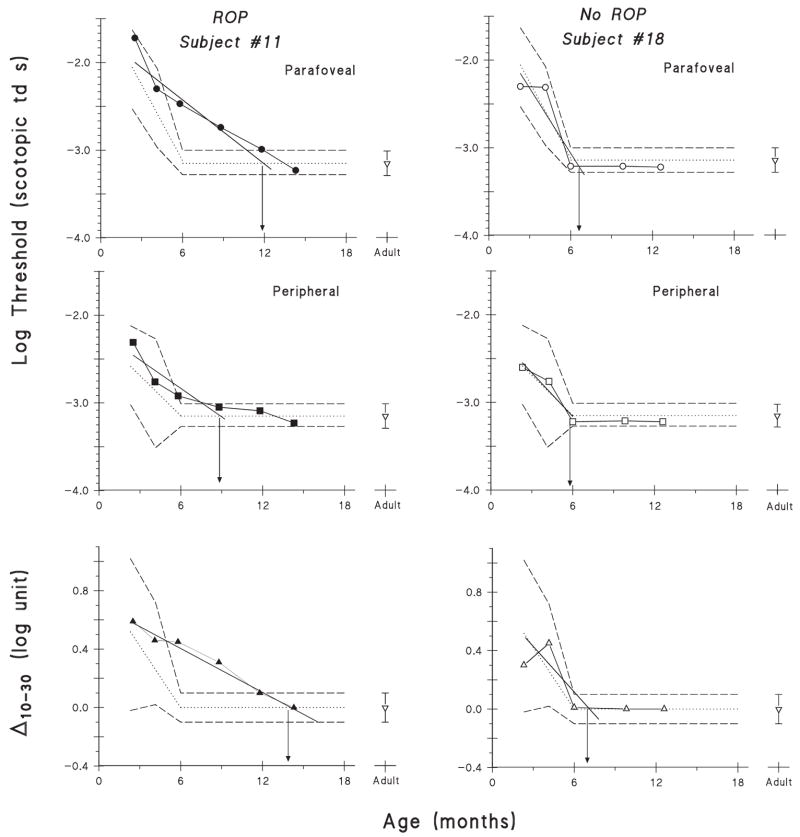
Results: The course of threshold maturation in subjects with ROP was significantly prolonged (P </= 0.01) compared with those who had never had ROP and with term-born control subjects. On average, parafoveal thresholds in subjects with ROP reached the adult level at a median age of 12 (range, 6-18) months, and peripheral thresholds reached the adult level at 9 (range, 5-12) months. Median thresholds in subjects who had never had ROP reached adult levels at both sites by approximately 7 months.

Conclusions: The slower development of parafoveal compared with peripheral thresholds in subjects with a history of ROP is evidence that the late-maturing parafoveal rods are more affected by the ROP disease process.


Figures

Figure 1
Figure 1
(A) ROP zones and location of stimuli. The position of the parafoveal and peripheral stimuli (●) are superimposed on a diagram of the ROP zones, as defined by the International Classification of ROP. The ROP zones are centered on the optic disc (○). The fovea is indicated by the X. (B) The screen and stimuli (not to scale). The 2° diameter stimuli at the parafoveal (10° eccentric) and peripheral (30° eccentric) sites are indicated. + indicates the central fixation display. (C) Templates for normal threshold development based on longitudinal data from term-born infants. Top: parafoveal threshold as a function of age; middle: peripheral threshold; bottom: Δ10–30. In each panel, the average course of threshold development for term born infants is represented by the sloping dotted line which is the mean regression for threshold data from 2 to 6 months. After 6 months, the horizontal dotted line is plotted at the mean adult threshold. By age 6 months, parafoveal and peripheral thresholds in term-born infants are equal to those in adults. The difference between parafoveal and peripheral thresholds (Δ10–30) is 0 by age 6 months, as it is in adults (bottom). Dashed lines in all panels: the upper and lower limits of the 99% PI for normal. Triangles in all panels: adult mean. Error bars, 99% prediction limits in adults.
Figure 2
Figure 2
Parafoveal thresholds, peripheral thresholds, and Δ10–30 of subjects with a history of ROP (n = 12) plotted as a function of corrected age. Dashed lines: the 99% PI for normal, replotted from Figure 1C.
Figure 3
Figure 3
Parafoveal thresholds, peripheral thresholds, and Δ10–30 of subjects without ROP (n = 12) plotted as a function of corrected age. Dashed lines: the 99% PI for normal, replotted from Figure 1C.
Figure 4
Figure 4
Data for subject 11 with ROP and subject 18 without ROP. Parafoveal thresholds, peripheral thresholds, and Δ10–30 values are plotted as a function of corrected age. The points plot each subject’s thresholds; the regression line, extended past the adult mean, is also shown. Arrows in all panels: the age at which the regression line reached the mean adult threshold (Table 2). Other features of these graphs are as in Figure 1C.
Figure 5
Figure 5
Results of the regression analysis for development of parafoveal threshold, peripheral thresholds, and Δ10–30 Top: the slope of the regression line for each subject; bottom: the age at which each subject’s regression reached the adult mean threshold. Horizontal lines: the medians for the ROP and no-ROP groups. The average slope and age to reach the adult mean threshold (±1 SD) for term-born control infants are plotted in each panel.

References

    1. LaVail MM, Rappaport DH, Rakic P. Cytogenesis in the monkey retina. J Comp Neurol. 1991;309:86–114. - PubMed
    1. Hendrickson AE, Drucker D. The development of parafoveal and midperipheral retina. Behav Brain Res. 1992;19:21–32. - PubMed
    1. Hendrickson AE. The morphologic development of human and monkey retina. In: Albert DM, Jakobiec FA, editors. Principles and Practice of Ophthalmology: Basic Sciences. Philadelphia: WB Saunders Co.; 1994. pp. 561–577.
    1. Dorn EM, Hendrickson L, Hendrickson AE. The appearance of rod opsin during monkey retinal development. Invest Ophthalmol Vis Sci. 1995;36:2634–2651. - PubMed
    1. Timmers AM, Fox D, He L, Hansen RM, Fulton AB. Rod photoreceptor maturation does not vary with retinal eccentricity in mammalian retina. Curr Eye Res. 1999;18:393–402. - PubMed

Publication types