

Haseman-Elston regression in ascertained samples: importance of dependent variable and mean correction factor selection
- PMID: 17898537
- PMCID: PMC2857627
- DOI: 10.1159/000108938
Haseman-Elston regression in ascertained samples: importance of dependent variable and mean correction factor selection
Abstract
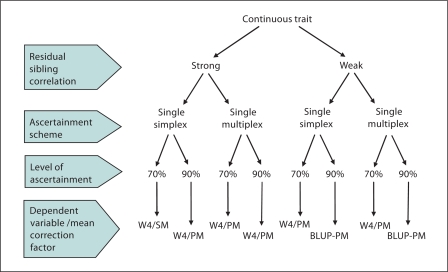
Objective: One of the first tools for performing linkage analysis, Haseman-Elston regression (HE), has been successfully used to identify linkages to several disease traits. A recent explosion in extensions of HE leaves one faced with the task of choosing a flavor of HE best suited for a given situation. This paper puts this dilemma into perspective and proposes a modification to HE for highly ascertained samples (BLUP-PM).
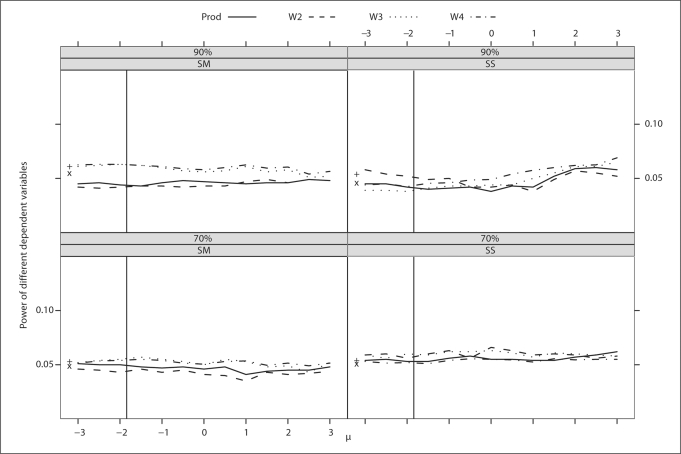
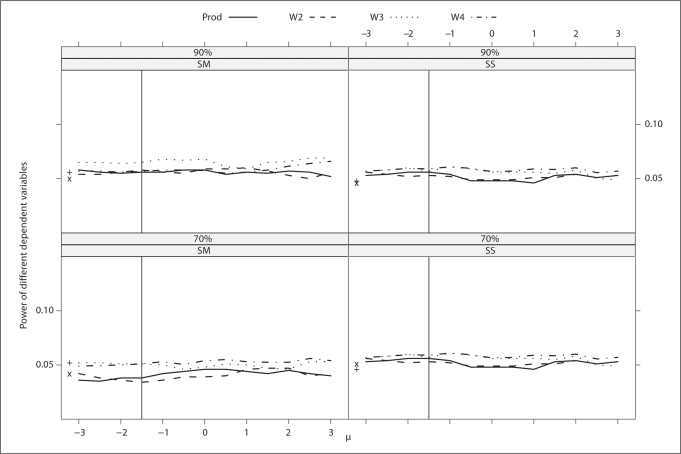
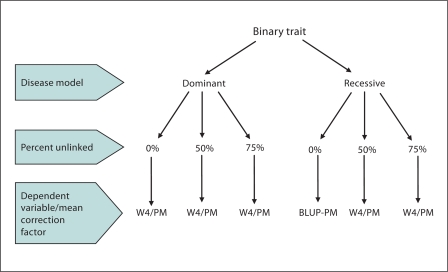
Methods: Using data simulated for a range of models, we evaluated type I error and power of several dependent variables in HE, including the novel BLUP-PM.
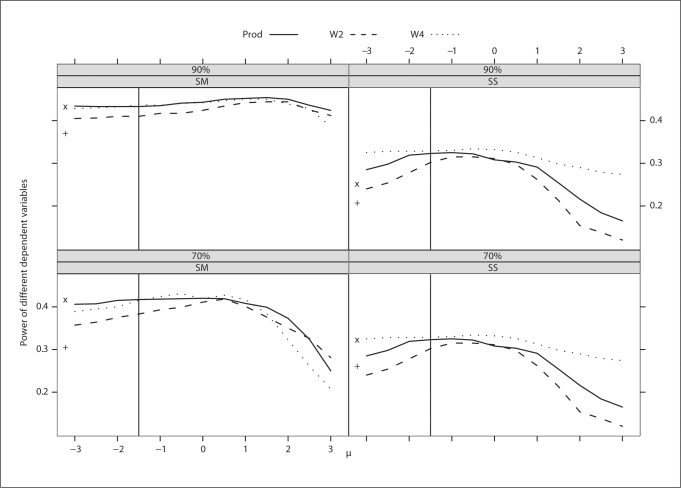
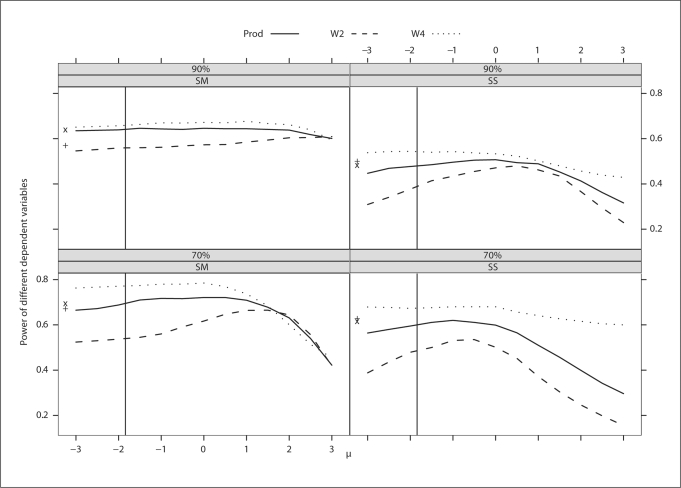
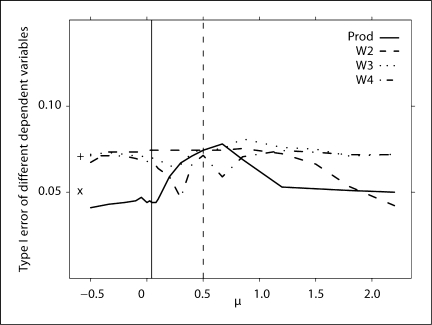
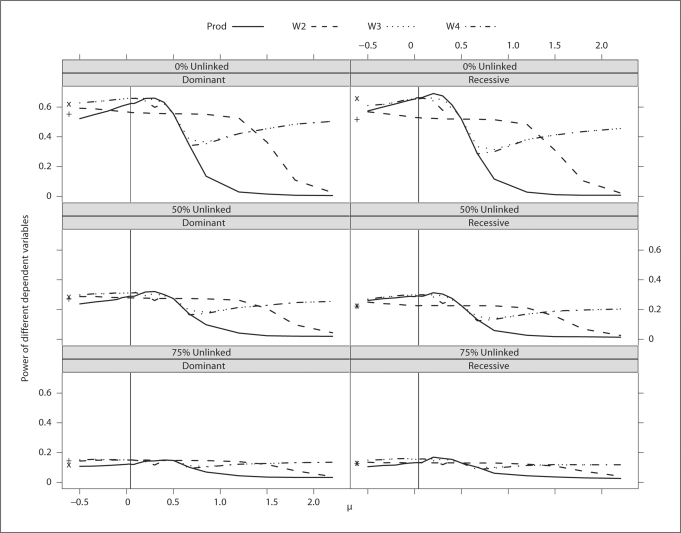
Results: When analyzing a continuous trait, even in highly ascertained samples, type I error is stable and approximately nominal across dependent variables. When analyzing binary traits in highly ascertained samples, type I error is elevated and unstable for all except BLUP-PM. Regardless of trait type, the optimally weighted HE regression and BLUP-PM have the greatest power.
Conclusions: Ascertained samples do not always reflect the population from which they are drawn and therefore choice of dependent variable in HE becomes increasingly important. Our results do not reveal a single, universal choice, but offer criteria by which to choose and demonstrate BLUP-PM performs well in most situations.
(c) 2007 S. Karger AG, Basel.
Figures
References
-
- Haseman JK, Elston RC. The investigation of linkage between a quantitative trait and a marker locus. Behav Genet. 1972;2:3–19. - PubMed
-
- Elston RC, Buxbaum S, Jacobs KB, Olson JM. Haseman and Elston revisited. Genet Epidemiol. 2000;19:1–17. - PubMed
-
- Etzel CJ, Shete S, Beasley TM, Fernandez JR, Allison DB, Amos CI. Effect of Box-Cox transformation on power of Haseman-Elston and maximum-likelihood variance components tests to detect quantitative trait loci. Hum Hered. 2003;55:108–116. - PubMed
-
- Forrest WF. Weighting improves the ‘new Haseman-Elston’ method. Hum Hered. 2001;52:47–54. - PubMed
-
- Palmer LJ, Jacobs KB, Elston RC. Haseman and Elston revisited: the effects of ascertainment and residual familial correlations on power to detect linkage. Genet Epidemiol. 2000;19:456–460. - PubMed
Publication types
MeSH terms
Grants and funding
LinkOut - more resources
Full Text Sources
