

Sensitivity of EEG and MEG to the N1 and P2 auditory evoked responses modulated by spectral complexity of sounds
- PMID: 17899352
- PMCID: PMC4373076
- DOI: 10.1007/s10548-007-0031-4
Sensitivity of EEG and MEG to the N1 and P2 auditory evoked responses modulated by spectral complexity of sounds
Abstract
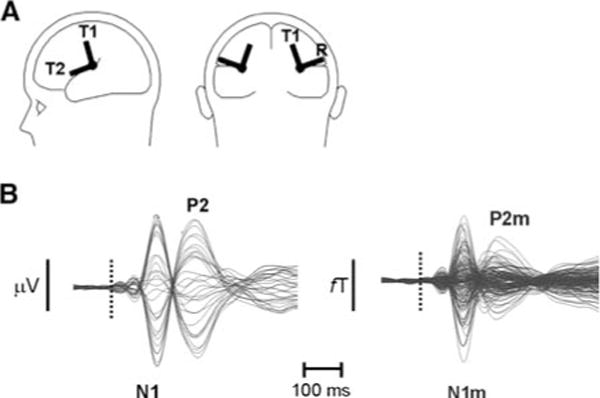
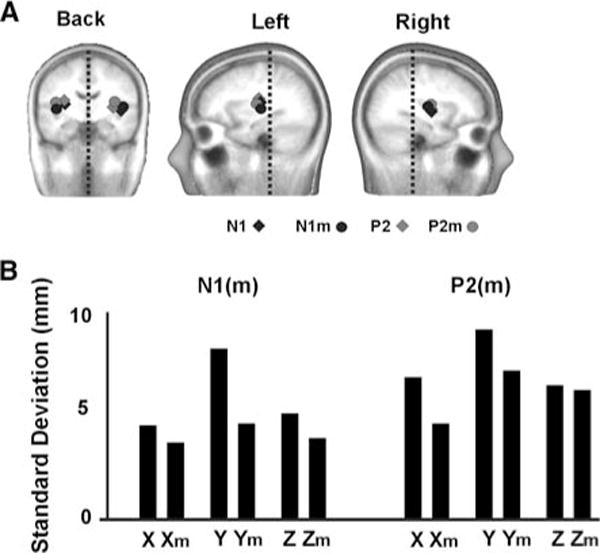
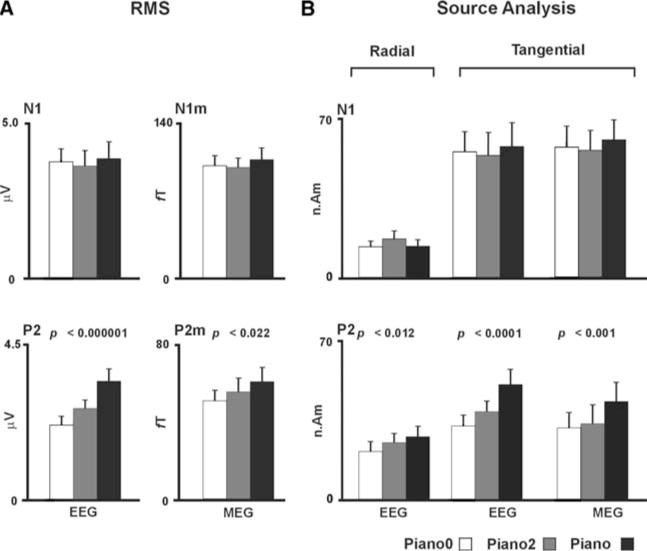
Acoustic complexity of a stimulus has been shown to modulate the electromagnetic N1 (latency approximately 110 ms) and P2 (latency 190 ms) auditory evoked responses. We compared the relative sensitivity of electroencephalography (EEG) and magnetoencephalography (MEG) to these neural correlates of sensation. Simultaneous EEG and MEG were recorded while participants listened to three variants of a piano tone. The piano stimuli differed in their number of harmonics: the fundamental frequency (f ( 0 )), only, or f ( 0 ) and the first two or eight harmonics. The root mean square (RMS) of the amplitude of P2 but not N1 increased with spectral complexity of the piano tones in EEG and MEG. The RMS increase for P2 was more prominent in EEG than MEG, suggesting important radial sources contributing to the P2 only in EEG. Source analysis revealing contributions from radial and tangential sources was conducted to test this hypothesis. Source waveforms revealed a significant increase in the P2 radial source amplitude in EEG with increased spectral complexity of piano tones. The P2 of the tangential source waveforms also increased in amplitude with increased spectral complexity in EEG and MEG. The P2 auditory evoked response is thus represented by both tangential (gyri) and radial (sulci) activities. The radial contribution is expressed preferentially in EEG, highlighting the importance of combining EEG with MEG where complex source configurations are suspected.
Figures
References
-
- Hämäläinen M, Hari R, Ilmoniemi RJ, Kunuutila J, Lounasmaa OV. Magnetoencephalography: theory, instrumentation, and applications to noninvasive studies of the working human brain. Rev Modern Phys. 1993;65:413–97.
-
- Nunez PL, Srinivasan R. Electric fields of the brain: the neurophysics of EEG. New York, NY: Oxford University Press; 2006.
-
- Neukirch M, Hegerl U, Kotitz R, Dorn H, Gallinat J, Herrmann WM. Comparison of the amplitude/intensity function of the auditory evoked N1m and N1 components. Neuropsychobiology. 2002;45:41–8. - PubMed
-
- Cuffin BN, Cohen D. Comparison of the magnetoencephalogram and electroencephalogram. Electroencephalogr Clin Neurophysiol. 1979;47:132–46. - PubMed
-
- Cohen D, Cuffin BN. Demonstration of useful differences between magnetoencephalogram and electroencephalogram. Electroencephalogr Clin Neurophysiol. 1983;56:38–51. - PubMed
Publication types
MeSH terms
Grants and funding
LinkOut - more resources
Full Text Sources
