. 2007;8(9):R202.
doi: 10.1186/gb-2007-8-9-r202.

Regional differences in dosage compensation on the chicken Z chromosome

Affiliations

Regional differences in dosage compensation on the chicken Z chromosome

Esther Melamed et al. Genome Biol. 2007.

Abstract

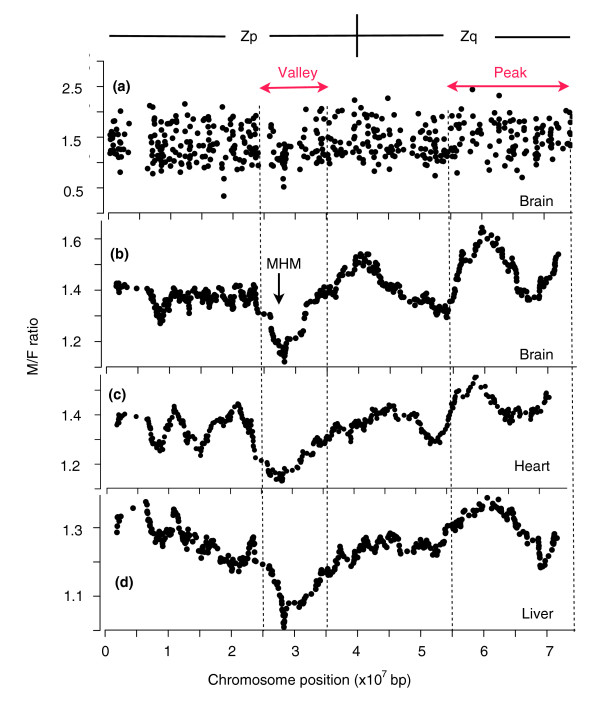
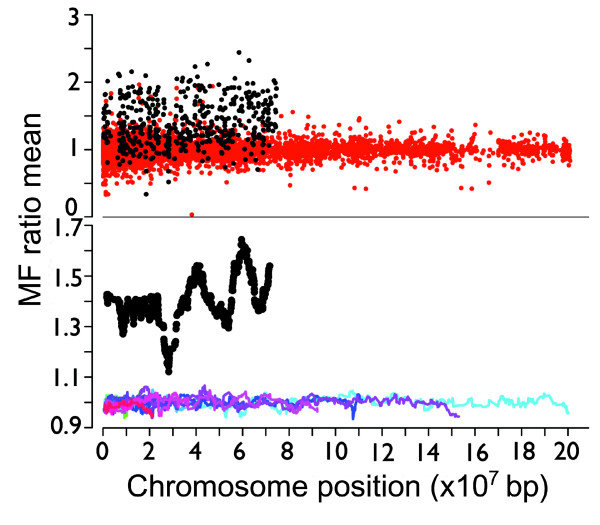
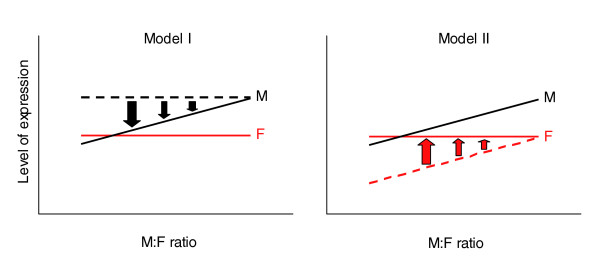
Background: Most Z chromosome genes in birds are expressed at a higher level in ZZ males than in ZW females, and thus are relatively ineffectively dosage compensated. Some Z genes are compensated, however, by an unknown mechanism. Previous studies identified a non-coding RNA in the male hypermethylated (MHM) region, associated with sex-specific histone acetylation, which has been proposed to be involved in dosage compensation.

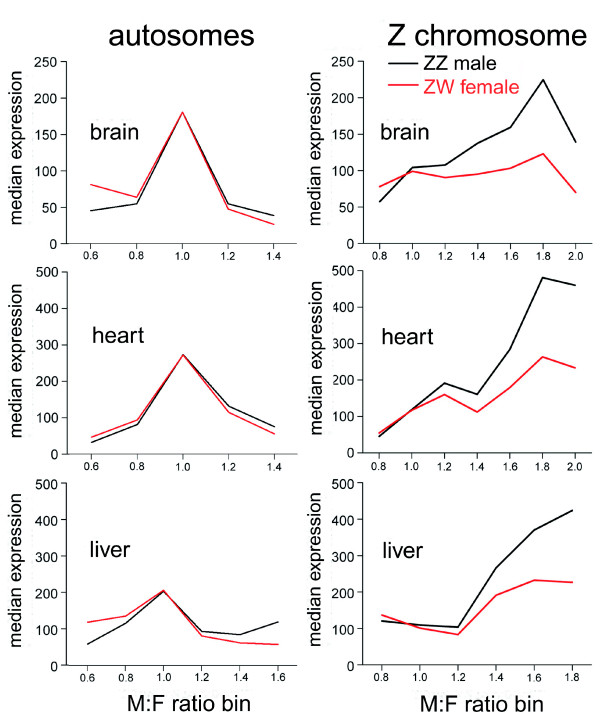
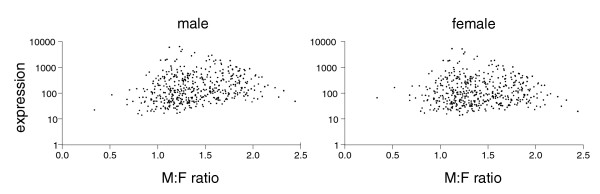
Results: Using microarray mRNA expression analysis, we find that dosage compensated and non-compensated genes occur across the Z chromosome, but a cluster of compensated genes are found in the MHM region of chicken chromosome Zp, whereas Zq is enriched in non-compensated genes. The degree of dosage compensation among Z genes is predicted better by the level of expression of Z genes in males than in females, probably because of better compensation of genes with lower levels of expression. Compensated genes have different functional properties than non-compensated genes, suggesting that dosage compensation has evolved gene-by-gene according to selective pressures on each gene. The group of genes comprising the MHM region also resides on a primitive mammalian (platypus) sex chromosome and, thus, may represent an ancestral precursor to avian ZZ/ZW and monotreme XX/XY sex chromosome systems.

Conclusion: The aggregation of dosage compensated genes near the MHM locus may reflect a local sex- and chromosome-specific mechanism of dosage compensation, perhaps mediated by the MHM non-coding RNA.


Figures

Figure 1
Figure 1
M:F ratios as a function of Z chromosome position for brain, heart, and liver tissues. (a) Individual M:F ratios in the brain, graphed by gene position on the Z chromosome. (b-d) The running average of 30 M:F ratios is plotted at the median gene position, for brain, heart, and liver. The curves all show a dip, or valley, surrounding the MHM locus of Zp, comprising a cluster of dosage compensated genes in a region deficient in genes with high M:F ratios, as well as an elevated region (one or two peaks) at the distal end of Zq with an unusual concentration of non-compensated genes.
Figure 2
Figure 2
Running average of M:F ratios on the Z chromosome and autosomes. Top: plot of the M:F ratio of individual Z genes in brain (black) compared with the expression genes for 18 autosomes (red) containing more than 200 genes. Bottom: the running average of M:F ratios (calculated as in Figure 1) for brain shows that the Z chromosome (black) has much more pronounced valleys and peaks than are found in the autosomes (red through blue).
Figure 3
Figure 3
ZZ male and ZW female expression levels as a function of M:F ratio. Graphs show the median expression level of genes as a function of M:F ratio. For each tissue, all genes showing expression from the Z chromosome or from autosomes 1-5 were grouped into bins according to M:F ratio. The graphs indicate that autosomal genes with high (>1.2) or low (<0.8) M:F ratios show generally lower expression, in both sexes, relative to genes that are equally expressed in the two sexes (M:F ratio near 1), indicating that sexually dimorphic expression is not associated with higher expression in one sex relative to the majority of genes. Among Z genes, expression in females varies little as M:F ratio changes. Male genes, however, are expressed significantly lower at low M:F ratios near 1, relative to higher M:F ratios. Bin width is 0.2. Values are plotted at the mid-point of the bin. A small number of genes, with M:F ratios outside of the range shown, are included in the most extreme bins.
Figure 4
Figure 4
Relationship between male and female gene expression and M:F ratio in brain. The level of expression of each gene in brain is plotted as a function of M:F ratio for each sex, to illustrate the correlation of the two variables in males but not females.
Figure 5
Figure 5
Models of sex-specific mechanisms of dosage compensation. Model 1 assumes that prior to compensation, female (red line) and male (dotted black line) expression is unrelated to the eventual amount of dosage compensation. If the male reduces expression of genes to compensate, the line tilts down on the left, resulting in a pattern of positive correlation of level of expression and M:F ratio (black solid line), close to that observed. Model II assumes that prior to dosage compensation, female (red dotted line) and male (black solid line) expression is correlated with the eventual level of compensation (lower average expression in genes to be compensated). In model II, female-specific compensation, illustrated by the shift to the red solid line in the female, leads to the observed pattern in which female expression does not correlate with M:F ratio. Arrows indicate shifts required in each model to achieve the observed pattern that male gene expression is correlated with M:F ratio, but female level of expression is not.

References

    1. Charlesworth B. The evolution of sex chromosomes. Science. 1991;251:1030–1033. doi: 10.1126/science.1998119. - DOI - PubMed
    1. Vallender EJ, Lahn BT. How mammalian sex chromosomes acquired their peculiar gene content. BioEssays. 2004;26:159–169. doi: 10.1002/bies.10393. - DOI - PubMed
    1. Graves JAM. Sex chromosome specialization and degeneration in mammals. Cell. 2006;124:901–914. doi: 10.1016/j.cell.2006.02.024. - DOI - PubMed
    1. Mizuno S, Kunita R, Nakabayashi O, Kuroda Y, Arai N, Harata M, Ogawa A, Itoh Y, Teranishi M, Hori T. Z and W chromosomes of chickens: studies on their gene functions in sex determination and sex differentiation. Cytogenet Genome Res. 2002;99:236–244. doi: 10.1159/000071599. - DOI - PubMed
    1. Birchler JA, Riddle NC, Auger DL, Veitia RA. Dosage balance in gene regulation: biological implications. Trends Genet. 2005;21:219–226. doi: 10.1016/j.tig.2005.02.010. - DOI - PubMed

Publication types