

Distinct mechanisms mediate visual detection and identification
- PMID: 17900902
- PMCID: PMC2772872
- DOI: 10.1016/j.cub.2007.09.012
Distinct mechanisms mediate visual detection and identification
Abstract
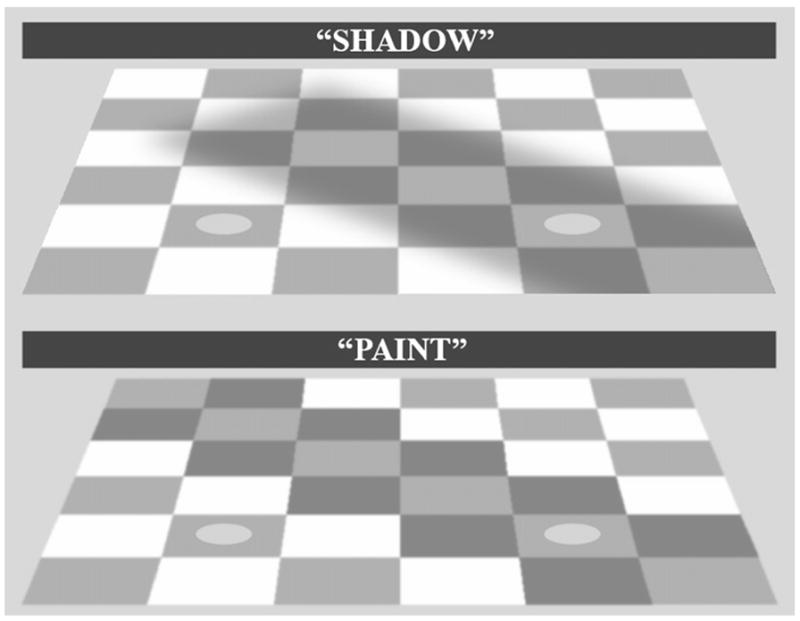
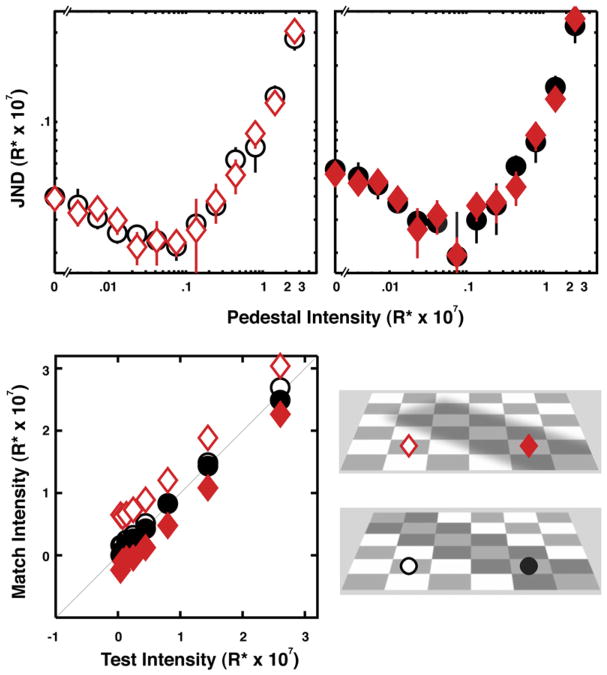
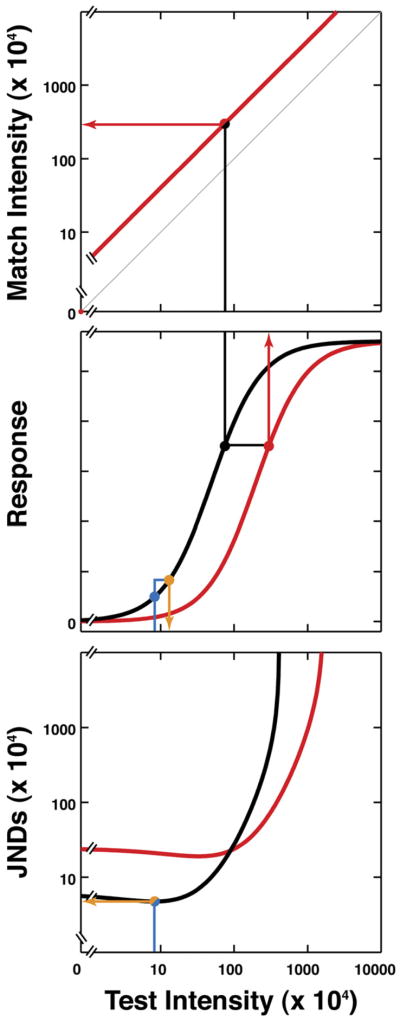
A core organizing principle for studies of the brain is that distinct neural pathways mediate distinct behavioral tasks [1, 2]. When two related tasks are mediated by a common pathway, studies of one are likely to generalize to the other. Here, we test whether performance on two laboratory tasks that model object detection and identification are mediated by common mechanisms of visual adaptation. Although both tasks rely on the luminance pattern in images, their demands on visual processing are quite different. Object detection requires discriminating image luminance differences associated with the light reflected from adjacent objects. To encode these differences reliably, neurons adapt their limited dynamic range to prevailing viewing conditions [3-6]. Object identification, on the other hand, demands a fixed response to light reflected from an object independent of illumination [7]. We compared performance in discrimination and identification tasks for simulated surfaces. In striking contrast to studies with less structured contexts, we found clear evidence that distinct processes mediate judgments in the two tasks. These results challenge models that account for perceived lightness entirely through the action of image-encoding mechanisms.
Figures
Similar articles
-
Image segmentation and lightness perception.Nature. 2005 Mar 3;434(7029):79-83. doi: 10.1038/nature03271. Nature. 2005. PMID: 15744303
-
Luminance gradient can break background-independent lightness constancy.Perception. 2003;32(3):263-8. doi: 10.1068/p3341. Perception. 2003. PMID: 12729378
-
A magnocellular contribution to conscious perception via temporal object segmentation.J Exp Psychol Hum Percept Perform. 2014 Jun;40(3):948-59. doi: 10.1037/a0035769. Epub 2014 Feb 3. J Exp Psychol Hum Percept Perform. 2014. PMID: 24490947
-
Lightness perception: seeing one color through another.Curr Biol. 2005 May 10;15(9):R330-2. doi: 10.1016/j.cub.2005.04.028. Curr Biol. 2005. PMID: 15886088 Review.
-
Perceiving the intensity of light.Psychol Rev. 2004 Jan;111(1):142-58. doi: 10.1037/0033-295X.111.1.142. Psychol Rev. 2004. PMID: 14756591 Review.
Cited by
-
The effect of background and illumination on color identification of real, 3D objects.Front Psychol. 2013 Nov 11;4:821. doi: 10.3389/fpsyg.2013.00821. eCollection 2013. Front Psychol. 2013. PMID: 24273521 Free PMC article.
-
Neuronal population mechanisms of lightness perception.J Neurophysiol. 2018 Nov 1;120(5):2296-2310. doi: 10.1152/jn.00906.2017. Epub 2018 Aug 15. J Neurophysiol. 2018. PMID: 30110233 Free PMC article.
-
The tilt illusion arises from an efficient reallocation of neural coding resources at the contextual boundary.bioRxiv [Preprint]. 2024 Sep 17:2024.09.17.613538. doi: 10.1101/2024.09.17.613538. bioRxiv. 2024. Update in: Proc Natl Acad Sci U S A. 2025 Apr 29;122(17):e2421565122. doi: 10.1073/pnas.2421565122. PMID: 39345627 Free PMC article. Updated. Preprint.
-
A unified account of perceptual layering and surface appearance in terms of gamut relativity.PLoS One. 2014 Nov 17;9(11):e113159. doi: 10.1371/journal.pone.0113159. eCollection 2014. PLoS One. 2014. PMID: 25402466 Free PMC article.
-
Increasing magnitude of color differences amplifies category effects.Sci Rep. 2024 Jun 13;14(1):13665. doi: 10.1038/s41598-024-64215-0. Sci Rep. 2024. PMID: 38871867 Free PMC article.
References
-
- Mishkin M, Ungerleider LG, Macko KA. Object vision and spatial vision: Two cortical pathways. Trends Neurosci. 1983;6:414–417.
-
- Van Essen DC, Felleman DJ, DeYoe EA, Olavarria J, Knierim J. Modular and hierarchial organization of extrastriate visual cortex in the macaque monkey. Cold Spring Harb Symp Quant Biol LV. 1990:679–685. - PubMed
-
- Attneave F. Informational aspects of visual perception. Psychol Rev. 1954;61:183–193. - PubMed
-
- Barlow HB. Possible principles underlying the transformations of sensory messages. In: Rosenblith WA, editor. Sensory Communication. Cambridge, MA and Hoboken, NJ: M. I. T. Press and John Wiley & Sons, Inc; 1961. pp. 217–234.
-
- Hood DC, Finkelstein MA. Senstivity to light. In: Boff KR, Kaufman L, Thomas JP, editors. Handbook of Perception and Human Performance: Sensory Processes and Perception. Vol. 1. Hoboken, NJ: John Wiley & Sons; 1986.
Publication types
MeSH terms
Grants and funding
LinkOut - more resources
Full Text Sources
