. 2007 Oct 9;104(41):16257-62.
doi: 10.1073/pnas.0705321104. Epub 2007 Sep 27.

MAP kinase phosphatase activity sets the threshold for thymocyte positive selection

Affiliations

MAP kinase phosphatase activity sets the threshold for thymocyte positive selection

Matthew L Bettini et al. Proc Natl Acad Sci U S A. .

Abstract

Phosphorylation of MAP kinases is important for proper translation of T cell antigen receptor (TCR) signals into thymocyte cell fates, but the role of MAP kinase phosphatase (MKP) activity in thymocyte development has not been characterized. To explore the role of MKP in thymocytes, we constructed a double mutant MKP-3 (DM-MKP3) that acts as a dominant-negative inhibitor of ERK- and JNK-specific MKP. Thymocytes developing in the presence of DM-MKP3 have enhanced frequencies of both CD4 and CD8 mature, single-positive cells and no increase in apoptosis. Expression of DM-MKP3 also results in an increased proportion of thymocytes with high levels of both CD69 and TCRbeta, suggesting that the increased proportion of mature thymocytes is the result of an increased probability that CD4(+)CD8(+) cells will be positively selected. Thus, MKP activity controls thymocyte cell fate by regulating the threshold of TCR signaling that is able to induce positive selection.


Conflict of interest statement

The authors declare no conflict of interest.

Figures
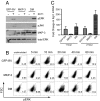
Fig. 1.
Fig. 1.
Wild-type MKP-3 prevents and DM-MKP3 enhances ERK and JNK activation. (A) D9 cells were transduced with empty vector (GFP-RV), MKP-3, or DM-MKP3 such that >90% of the cells were GFP+. The cells were stimulated with anti-CD3ε for 5 min, and the amounts of pERK, pJNK, MKP-3, and total ERK in 0.2% Nonidet P-40 lysates were determined by immunoblot. The blot shown is representative of at least three independent experiments. (B) Transduced D9 cells were stimulated with plate-bound anti-CD3ε for the indicated times and then fixed, permeabilized, and stained with anti-pERK. The dot plots show forward scatter versus pERK staining on GFP+ cells. These plots are representative of at least three independent experiments. (C) Transduced D9 cells (>90% GFP+) were stimulated with anti-CD3ε for 1 or 2 h, RNA was isolated, and egr1 expression (normalized to β-actin) was determined by quantitative real-time PCR. The data represent the mean ± SEM of five separate experiments. Differences between GFP-RV and MKP-3 (P = 0.03), as well as between GFP-RV and DM-MKP3 (P = 0.03), at 2 h were statistically significant as determined by Mann–Whitney U test.
Fig. 2.
Fig. 2.
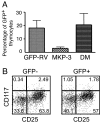
Expression of MKP-3 and DM-MKP-3 in vivo. (A) Bone marrow progenitors from B6.AKR (Thy1.2) mice were transduced with GFP-RV, MKP-3, or DM-MKP3 so that 10–20% of the cells were GFP+. The transduced progenitors were then injected i.v. into lethally irradiated B6.AKR (Thy1.1) mice. Six weeks after bone marrow transfer, thymocytes and bone marrow cells were analyzed by flow cytometry. The graph shows mean percentages ± SEM for GFP+ thymocytes. GFP-RV, n = 11; MKP-3, n = 9; DM-MKP3, n = 7. The difference between GFP-RV and MKP-3 was significant (P = 0.01) as determined by Mann–Whitney U test. (B) Bone marrow progenitors transduced with DM-MKP3 were injected into an irradiated recipient mouse. Six weeks after bone marrow transfer, thymocytes were stained with a mixture of lineage markers, plus anti-CD117 and anti-CD25. Lineage-negative cells were divided into GFP and GFP+ populations, and CD117 versus CD25 dot plots are shown.
Fig. 3.
Fig. 3.
Increased positive selection of CD4SP and CD8SP thymocytes in the presence of high levels of DM-MKP3. B6.AKR (Thy1.2+) bone marrow was transduced with DM-MKP3 and injected into irradiated B6.AKR (Thy1.1+) mice. Six weeks later, thymocytes were analyzed by flow cytometry. Four gates were drawn on GFP+ cells. The CD4 versus CD8 as well as the CD69 versus TCRβ dot plots were determined for GFP cells and the four groups of GFP+ cells. The data shown are representative of seven different chimeric mice.
Fig. 4.
Fig. 4.
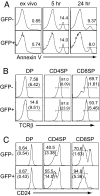
DM-MKP3 does not alter apoptosis of thymocytes, but increases the percentage of mature thymocytes. (A) B6.AKR (Thy1.2+) bone marrow was transduced with DM-MKP3 and injected into irradiated B6.AKR (Thy1.1+) mice. Six to 10 weeks later, thymocytes were analyzed by flow cytometry. Thymocytes were stained with annexin V directly ex vivo or after 5 or 24 h in culture. The numbers show the percentages of annexin V-positive cells after gating on GFP and GFP+. These data are representative of the analysis of four chimeric mice. (B) DM-MKP3 chimeric mice were analyzed 6 to 10 weeks after bone marrow transfer. Cells were electronically divided into GFP and GFP+ populations, and the TCRβ staining on DP, CD4SP, and CD8SP subsets is shown. The numbers on the histograms show the percentages of each subset that is TCRβhi. The numbers in parentheses show the percentages of cells within each GFP gate that are TCRβhi and fall within the subset. These data are representative of the analysis of five chimeric mice. (C) DM-MKP3 chimeric mice were analyzed as in B, with staining for CD24 instead of TCRβ. These data are representative of the analysis of five chimeric mice.
Fig. 5.
Fig. 5.
DM-MKP3 enhances Egr1 induction in DP thymocytes. (A) Six to 10 weeks after bone marrow transfer, DM-MKP3 chimeric thymocytes were stained with anti-CD4 and anti-CD8 and then fixed, permeabilized, and stained intracellularly with anti-Egr1 directly ex vivo (0 h). Thymocytes also were stimulated for 1 and 2 h with plate-bound anti-CD3ε and then stained similarly. After gating on DP thymocytes, the percentage of Egr1-positive cells was determined in GFP and GFP+ populations. The data shown are the mean ± SEM for seven different mice. The percentages of GFP+ cells that are Egr1+ are statistically significantly different from the corresponding values among GFP cells at both 1 h (P = 0.0008) and 2 h (P = 0.0013) as determined by Student's t test. (B) Five weeks after bone marrow transfer, DM-MKP3 chimeric thymocytes were stained for anti-CD4, anti-CD8, and phospho-ERK. The data show the percentage of DP thymocytes that were phospho-ERK-positive in the GFP+ and GFP populations. Staining was done directly ex vivo or after 10 or 20 min of anti-CD3ε stimulation. The data shown are the mean ± SEM for three different mice.

References

    1. Sebzda E, Mariathasan S, Ohteki T, Jones R, Bachmann MF, Ohashi PS. Annu Rev Immunol. 1999;17:829–874. - PubMed
    1. Fischer AM, Katayama CD, Pages G, Pouyssegur J, Hedrick SM. Immunity. 2005;23:431–443. - PubMed
    1. Rincon M, Whitmarsh A, Yang DD, Weiss L, Derijard B, Jayaraj P, Davis RJ, Flavell RA. J Exp Med. 1998;188:1817–1830. - PMC - PubMed
    1. Alberola-Ila J, Hogquist KA, Swan KA, Bevan MJ, Perlmutter RM. J Exp Med. 1996;184:9–18. - PMC - PubMed
    1. Sharp LL, Schwarz DA, Bott CM, Marshall CJ, Hedrick SM. Immunity. 1997;7:609–618. - PubMed

Publication types

MeSH terms

Substances