

Income inequality and socioeconomic gradients in mortality
- PMID: 17901426
- PMCID: PMC2376999
- DOI: 10.2105/AJPH.2007.109637
Income inequality and socioeconomic gradients in mortality
Abstract
Objectives: We investigated whether the processes underlying the association between income inequality and population health are related to those responsible for the socioeconomic gradient in health and whether health disparities are smaller when income differences are narrower.
Methods: We used multilevel models in a regression analysis of 10 age- and cause-specific US county mortality rates on county median household incomes and on state income inequality. We assessed whether mortality rates more closely related to county income were also more closely related to state income inequality. We also compared mortality gradients in more- and less-equal states.
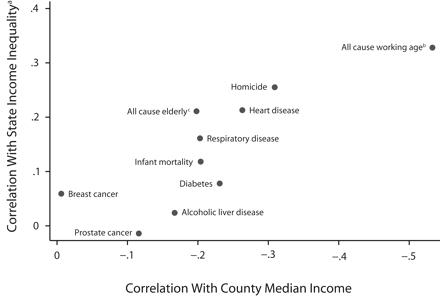
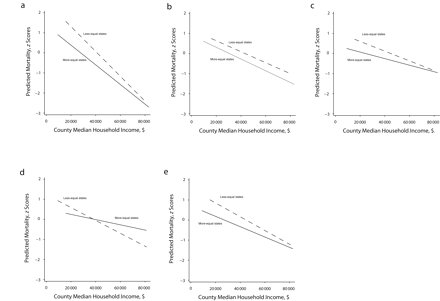
Results: Mortality rates more strongly associated with county income were more strongly associated with state income inequality: across all mortality rates, r= -0.81; P=.004. The effect of state income inequality on the socioeconomic gradient in health varied by cause of death, but greater equality usually benefited both wealthier and poorer counties.
Conclusions: Although mortality rates with steep socioeconomic gradients were more sensitive to income distribution than were rates with flatter gradients, narrower income differences benefit people in both wealthy and poor areas and may, paradoxically, do little to reduce health disparities.
Figures
References
-
- Wilkinson RG, Pickett KE. Income inequality and population health: a review and explanation of the evidence. Soc Sci Med. 2006;62:1768–1784. - PubMed
-
- Lynch JW, Kaplan GA, Salonen JT. Why do poor people behave poorly? Variation in adult health behaviours and psychosocial characteristics by stages of the socioeconomic lifecourse. Soc Sci Med. 1997;44:809–819. - PubMed
Publication types
MeSH terms
Grants and funding
LinkOut - more resources
Full Text Sources
Medical
