

Review
doi: 10.1186/1471-2202-8-S3-S3.
Behavioral genetics and taste
Affiliations
- PMID: 17903279
- PMCID: PMC1995453
- DOI: 10.1186/1471-2202-8-S3-S3
Item in Clipboard
Review
Behavioral genetics and taste
BMC Neurosci.
.
Abstract
This review focuses on behavioral genetic studies of sweet, umami, bitter and salt taste responses in mammals. Studies involving mouse inbred strain comparisons and genetic analyses, and their impact on elucidation of taste receptors and transduction mechanisms are discussed. Finally, the effect of genetic variation in taste responsiveness on complex traits such as drug intake is considered. Recent advances in development of genomic resources make behavioral genetics a powerful approach for understanding mechanisms of taste.
Figures
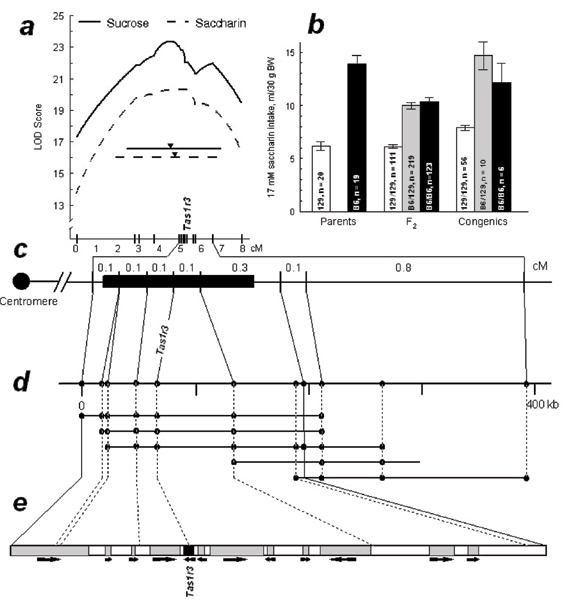
Positional identification of the Sac (saccharin preference) locus.a. Linkage map of mouse distal Chr 4 based on data from the B6 × 129 F2 intercross. The X axis shows distances between markers in recombination units (cM). The Y axis shows the logarithm of the odds ratio (LOD) scores for sucrose and saccharin consumption. The LOD score peaks (indicated by black triangles) and confidence intervals (solid horizontal line for sucrose, 4.5 cM, and dotted horizontal line for saccharin, 5.3 cM) define the genomic region of the Sac locus. b. Average daily 17 mM saccharin consumption by mice from parental 129 and B6 strains (left), B6 × 129 F2 hybrids (center), and congenic 129.B6-Sac mice (right) in 96-hr two-bottle tests with water (means ± SE). Tas1r3 genotypes of the F2 and congenic mice and mouse numbers are indicated on the bars. Differences between parental strains and among the F2 and congenic genotypes were significant (p < 0.0001, ANOVA). F2 and congenic B6 homozygotes and heterozygotes for Tas1r3 did not differ from each other, and had higher saccharin intakes compared with 129 homozygotes (p < 0.0001, post hoc tests). c. Linkage map of the Sac-containing region defined based on the size of the donor fragment in the 129.B6-Sac congenic strain (black box). Distances between markers were estimated based on the B6 × 129 F2 intercross (see panel a). d. A contig of bacterial artificial chromosome (BAC) clones and physical map of the Sac region. BAC clones are represented by horizontal lines. Dots indicate marker content of the BAC clones. e. Genes within the Sac-containing interval. Filled areas indicate predicted genes. Arrows indicate the predicted direction of transcription. Figure reproduced with permission from [253].

Preference for 1.6 mM saccharin by mice from inbred strains with different Tas1r3 genotypes at the T/C variant site at nucleotide position +179 (relative to the first nucleotide in the ATG start codon of the Tas1r3 gene). This polymorphism results in amino acid substitution of isoleucine to threonine at position 60 (I60T), in the extracellular N-terminus of the predicted T1R3 protein. Closed circles denote means for C57BL/6, C57L/J, CAST/Ei, CE/J, FVB/NJ, I/LnJ, IS/Cam, KK/HlJ, NOD/LtJ, NZB/BlNJ, P/J, RBF/DnJ, SEA/GnJ, SJL/J, SM/J, SPRET/Ei, ST/bJ and SWR/J strains with +179 T genotype. Mice from these strains strongly preferred saccharin (average preference score 88 ± 2%, Mean ± SE; n = 18). Open circles show means for 129P3/J, A/J, AKR/J, BALB/cByJ, BUB/BnJ, C3H/HeJ, CBA/J, DBA/2J, LP/J, PL/J, RF/J and RIIIS/J strains with +179 C genotype. Mice from these strains were indifferent to or only weakly preferred saccharin (average preference score 59 ± 3%, n = 12; p = 0.00000000012, t-test). Despite the strong phenotypical effect of the Tas1r3 genotype, there is also substantial variation in saccharin preference within each genotype group. As a result, Tas1r3 genotype explains only 78% of genetic variation in saccharin preferences among the inbred strains; the remaining 22% of genetic variance is attributed to the effect of other genes. Adapted with permission from [53].
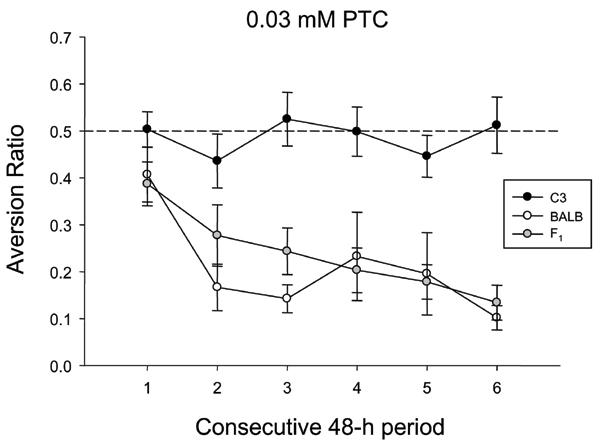
Aversion to PTC in taster mice develops over several days. Preference ratios (mean ± SE) for BALB/cBy (BALB), C3HeB/Fe (C3), and BALB × C3 F1 (n = 10/strain) to 0.03 mM PTC over six consecutive 48-h tests. The dotted line represents a preference score of 0.5, which indicates equivalent consumption from solution and water tubes. Preference ratios for BALB and F1 mice decreased following the initial test period; by the final test period these mice were strongly avoiding PTC. C3 mice remained indifferent to the taste of PTC across the entire test period. Strain differences in "developed aversion" to PTC have a genetic basis, with complete dominance of the avoider phenotype. However, the avoidance phenotype does not necessarily reflect increased bitter taste sensitivity. Figure from Boughter (unpublished).
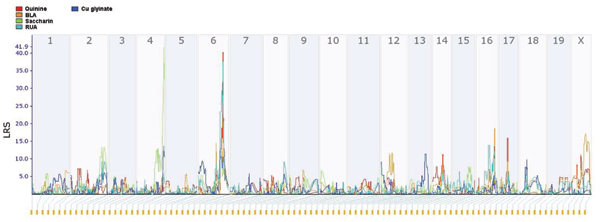
Genome-wide interval mapping of taste responses to bitter and sweet compounds: 0.1 – 0.4 mg/ml quinine, 0.3 mM beta-lactose acetate (BLA), 0.4 mM raffinose undecaacetate (RUA), 10 mM copper glycinate and 3.2 mM saccharin. LRS = Likelihood Ratio Score. The taste stimuli were tested in the two-bottle preference tests in the BXD recombinant inbred mouse strains. Phenotype data were previously published [46, 72, 151, 153] and are available at
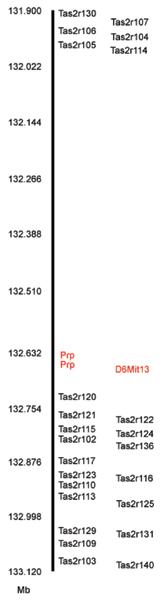
A map of the cluster of the Tas2r bitter taste genes on distal mouse Chr 6. Twenty-four intact Tas2r genes map to distal Chr 6 (black). The Tas2rs are found in two subclusters on either side of the polymorphic marker D6Mit13 (red) and two genes encoding proline-rich salivary proteins (Prp2 and Prh1; red). Map positions are in Mb (Build 33 assembly of the B6 genome). Figure copyright [30].
Similar articles
-
Genetics of human taste perception.J Dent Res. 2004 Jun;83(6):448-53. doi: 10.1177/154405910408300603. J Dent Res. 2004. PMID: 15153450 Review.
-
Diverse tastes: Genetics of sweet and bitter perception.Physiol Behav. 2006 Jun 30;88(3):215-26. doi: 10.1016/j.physbeh.2006.05.033. Epub 2006 Jun 19. Physiol Behav. 2006. PMID: 16782140 Free PMC article. Review.
-
Sweet, bitter and umami receptors: a complex relationship.Trends Biochem Sci. 2009 Jun;34(6):296-302. doi: 10.1016/j.tibs.2009.02.005. Epub 2009 May 13. Trends Biochem Sci. 2009. PMID: 19443222 Review.
-
Umami taste responses are mediated by alpha-transducin and alpha-gustducin.J Neurosci. 2004 Sep 1;24(35):7674-80. doi: 10.1523/JNEUROSCI.2441-04.2004. J Neurosci. 2004. PMID: 15342734 Free PMC article.
-
[Molecular receptors of taste agents].Bioorg Khim. 2009 Jan-Feb;35(1):5-14. Bioorg Khim. 2009. PMID: 19377517 Review. Russian.
Cited by
-
Double-dissociation of D1 and opioid receptor antagonism effects on the acquisition of sucrose-conditioned flavor preferences in BALB/c and SWR mice.Pharmacol Biochem Behav. 2012 Nov;103(1):26-32. doi: 10.1016/j.pbb.2012.07.018. Epub 2012 Aug 7. Pharmacol Biochem Behav. 2012. PMID: 22967990 Free PMC article.
-
Strain differences in the neural, behavioral, and molecular correlates of sweet and salty taste in naive, ethanol- and sucrose-exposed P and NP rats.J Neurophysiol. 2011 Nov;106(5):2606-21. doi: 10.1152/jn.00196.2010. Epub 2011 Aug 17. J Neurophysiol. 2011. PMID: 21849614 Free PMC article.
-
Genetics of taste receptors.Curr Pharm Des. 2014;20(16):2669-83. doi: 10.2174/13816128113199990566. Curr Pharm Des. 2014. PMID: 23886383 Free PMC article. Review.
-
Topographic organizations of taste-responsive neurons in the parabrachial nucleus of C57BL/6J mice: An electrophysiological mapping study.Neuroscience. 2016 Mar 1;316:151-66. doi: 10.1016/j.neuroscience.2015.12.030. Epub 2015 Dec 19. Neuroscience. 2016. PMID: 26708748 Free PMC article.
-
Strain differences in sucrose- and fructose-conditioned flavor preferences in mice.Physiol Behav. 2012 Jan 18;105(2):451-9. doi: 10.1016/j.physbeh.2011.09.010. Epub 2011 Sep 14. Physiol Behav. 2012. PMID: 21945373 Free PMC article.
References
Publication types
MeSH terms
Grants and funding
LinkOut - more resources
Full Text Sources
