

Review
doi: 10.1186/1471-2105-8-S6-S5.
Inferring cellular networks--a review
Affiliations
- PMID: 17903286
- PMCID: PMC1995541
- DOI: 10.1186/1471-2105-8-S6-S5
Item in Clipboard
Review
Inferring cellular networks--a review
BMC Bioinformatics.
.
Abstract
In this review we give an overview of computational and statistical methods to reconstruct cellular networks. Although this area of research is vast and fast developing, we show that most currently used methods can be organized by a few key concepts. The first part of the review deals with conditional independence models including Gaussian graphical models and Bayesian networks. The second part discusses probabilistic and graph-based methods for data from experimental interventions and perturbations.
Figures
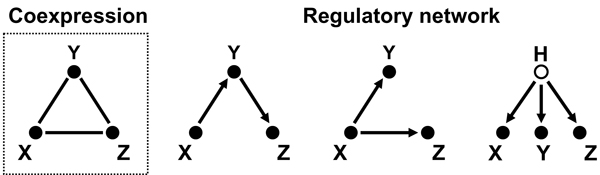
Different mechanisms can explain coexpression. The left plot in the dashed box shows three coexpressed genes forming a clique in the coexpression graph. The other three plots show possible regulatory relationships that can explain coexpression: The genes could be regulated in a cascade (left), or one regulates both others (middle), or there is a common "hidden" regulator (right), which is not part of the model.
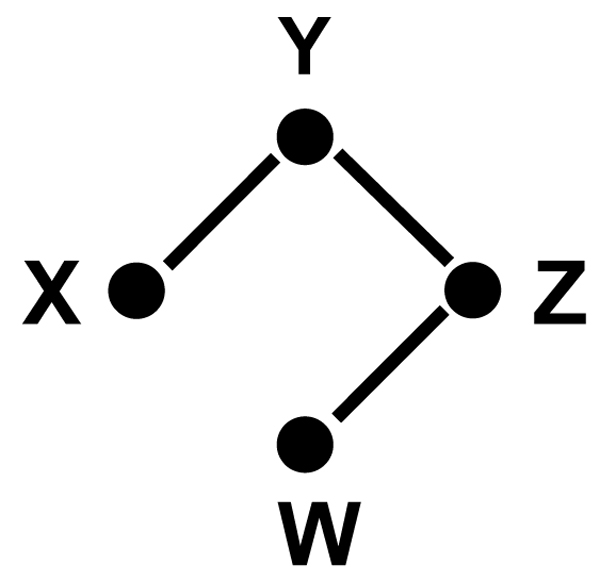
A small Gaussian graphical model. Example of a full conditional model. Missing edges between nodes indicate independencies of two genes given all the other genes in the model. We can read from the graph that X ⊥ W | {Y, Z} and Y ⊥ W | {X, Z} and X ⊥ Z | {Y, W}.
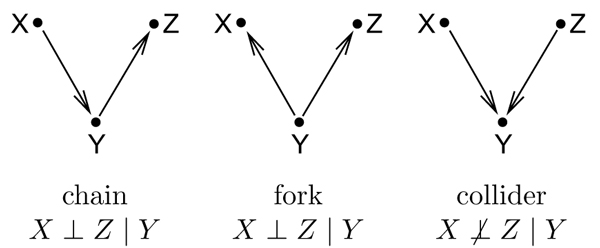
Conditional indendence in directed graphs. The three archetypal situations in the definition of d-separation. In the chain and the fork, conditioning on the middle node makes the others independent. In a collider, X and Z are marginally independent, but become dependent once Y is known.
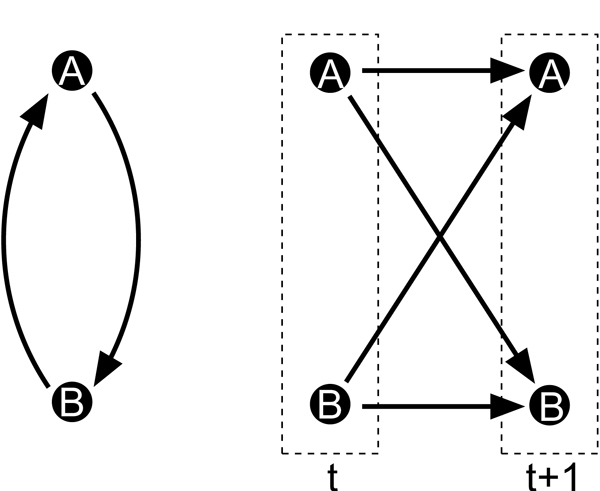
Cycles unroll over time. The cycle unrolls into an acyclic graph over different time slices.
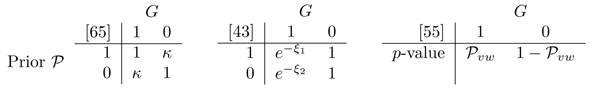
An overview of structure priors. Comparison of edge weights suggested by Heckerman et al. [65], Imoto et al. [43] and Bernard et al. [55]. Rows correspond to prior information. In the left two examples the prior can be described as binary, while on the right it is expressed as a p-value derived from a second data set. The entries in the table are the weights κvw for each edge depending on whether G agrees with P
MathType@MTEF@5@5@+=feaafiart1ev1aaatCvAUfKttLearuWrP9MDH5MBPbIqV92AaeXatLxBI9gBamrtHrhAL1wy0L2yHvtyaeHbnfgDOvwBHrxAJfwnaebbnrfifHhDYfgasaacH8akY=wiFfYdH8Gipec8Eeeu0xXdbba9frFj0=OqFfea0dXdd9vqai=hGuQ8kuc9pgc9s8qqaq=dirpe0xb9q8qiLsFr0=vr0=vr0dc8meaabaqaciaacaGaaeqabaWaaeGaeaaakeaacqqGqbauaaa@3786@
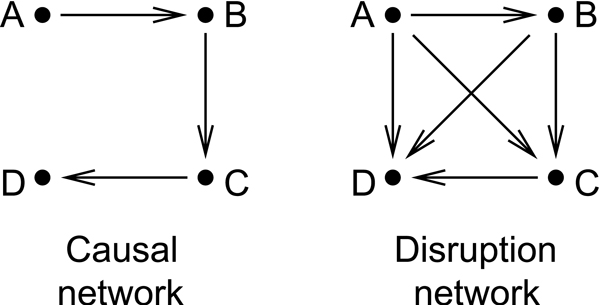
Causal and discruption network. From the causal network (left) it is easy to deduce how effects spread through the pathway (right). The harder problem is to deduce the causal pathway from observing effects of interventions (going from right to left).
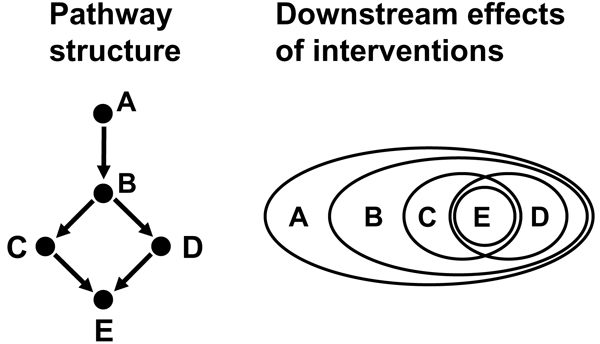
Nested effects models. Markowetz et al. [119] introduce a probabilistic model to infer a pathway structure (left) from the observed downstream effects of interventions (right). The model predicts that genes high up in the pathway (like A) will have a broader set of effects than genes more downstream (like B to E). The branching in the pathway below B corresponds to (partly) disjoint effect subsets for C and D. The intersection of effect sets for C and D can be attributed to E and is explained by the collider at E in the pathway.
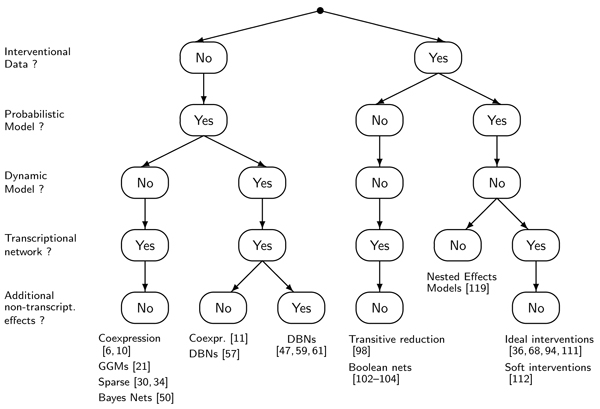
A guide to the literature on network reconstruction. Methodological similar approaches are clustered together by a decision tree built on five basic questions: Do the data contain knock-out or knock-down samples? Is the model deterministic or probabilistic? Does the model account for changes over time or is it static? Does the model focus on transcriptional gene regulation networks? And if so, does the model take additional non-transcriptional effects into account? In the leaf nodes of the tree, a few representative references are shown.
Similar articles
-
Bayesian dynamic multivariate models for inferring gene interaction networks.Conf Proc IEEE Eng Med Biol Soc. 2006;2006:2041-4. doi: 10.1109/IEMBS.2006.260091. Conf Proc IEEE Eng Med Biol Soc. 2006. PMID: 17946930
-
Inferring gene regulatory networks with time delays using a genetic algorithm.Syst Biol (Stevenage). 2005 Jun;152(2):67-74. doi: 10.1049/ip-syb:20050006. Syst Biol (Stevenage). 2005. PMID: 17044234
-
GenePro: a Cytoscape plug-in for advanced visualization and analysis of interaction networks.Bioinformatics. 2006 Sep 1;22(17):2178-9. doi: 10.1093/bioinformatics/btl356. Bioinformatics. 2006. PMID: 16921162
-
Graphs in molecular biology.BMC Bioinformatics. 2007 Sep 27;8 Suppl 6(Suppl 6):S8. doi: 10.1186/1471-2105-8-S6-S8. BMC Bioinformatics. 2007. PMID: 17903289 Free PMC article. Review.
-
Prediction of protein-protein interaction networks.Curr Protoc Bioinformatics. 2003 May;Chapter 8:Unit8.2. doi: 10.1002/0471250953.bi0802s01. Curr Protoc Bioinformatics. 2003. PMID: 18428709 Review.
Cited by
-
Unique ability of pandemic influenza to downregulate the genes involved in neuronal disorders.Mol Biol Rep. 2015 Sep;42(9):1377-90. doi: 10.1007/s11033-015-3916-4. Epub 2015 Aug 6. Mol Biol Rep. 2015. PMID: 26246405
-
DRAGON: Determining Regulatory Associations using Graphical models on multi-Omic Networks.Nucleic Acids Res. 2023 Feb 22;51(3):e15. doi: 10.1093/nar/gkac1157. Nucleic Acids Res. 2023. PMID: 36533448 Free PMC article.
-
Reverse engineering and identification in systems biology: strategies, perspectives and challenges.J R Soc Interface. 2013 Dec 4;11(91):20130505. doi: 10.1098/rsif.2013.0505. Print 2014 Feb 6. J R Soc Interface. 2013. PMID: 24307566 Free PMC article. Review.
-
A parallel algorithm for reverse engineering of biological networks.Integr Biol (Camb). 2011 Dec;3(12):1215-23. doi: 10.1039/c1ib00117e. Epub 2011 Nov 14. Integr Biol (Camb). 2011. PMID: 22080176 Free PMC article.
-
Modeling of Interactions between Cancer Stem Cells and their Microenvironment: Predicting Clinical Response.Methods Mol Biol. 2018;1711:333-349. doi: 10.1007/978-1-4939-7493-1_16. Methods Mol Biol. 2018. PMID: 29344897 Free PMC article. Review.
References
Publication types
MeSH terms
Substances
LinkOut - more resources
Full Text Sources
Other Literature Sources
