

Dissecting complex transcriptional responses using pathway-level scores based on prior information
- PMID: 17903287
- PMCID: PMC1995543
- DOI: 10.1186/1471-2105-8-S6-S6
Dissecting complex transcriptional responses using pathway-level scores based on prior information
Abstract
Background: The genomewide pattern of changes in mRNA expression measured using DNA microarrays is typically a complex superposition of the response of multiple regulatory pathways to changes in the environment of the cells. The use of prior information, either about the function of the protein encoded by each gene, or about the physical interactions between regulatory factors and the sequences controlling its expression, has emerged as a powerful approach for dissecting complex transcriptional responses.
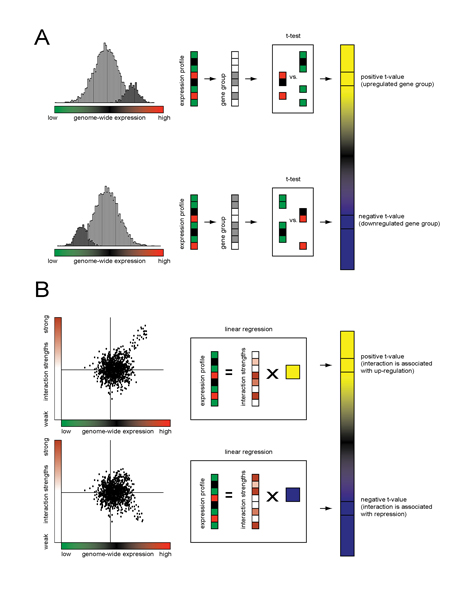
Results: We review two different approaches for combining the noisy expression levels of multiple individual genes into robust pathway-level differential expression scores. The first is based on a comparison between the distribution of expression levels of genes within a predefined gene set and those of all other genes in the genome. The second starts from an estimate of the strength of genomewide regulatory network connectivities based on sequence information or direct measurements of protein-DNA interactions, and uses regression analysis to estimate the activity of gene regulatory pathways. The statistical methods used are explained in detail.
Conclusion: By avoiding the thresholding of individual genes, pathway-level analysis of differential expression based on prior information can be considerably more sensitive to subtle changes in gene expression than gene-level analysis. The methods are technically straightforward and yield results that are easily interpretable, both biologically and statistically.
Figures
Similar articles
-
From biophysics to evolutionary genetics: statistical aspects of gene regulation.BMC Bioinformatics. 2007 Sep 27;8 Suppl 6(Suppl 6):S7. doi: 10.1186/1471-2105-8-S6-S7. BMC Bioinformatics. 2007. PMID: 17903288 Free PMC article. Review.
-
Graphs in molecular biology.BMC Bioinformatics. 2007 Sep 27;8 Suppl 6(Suppl 6):S8. doi: 10.1186/1471-2105-8-S6-S8. BMC Bioinformatics. 2007. PMID: 17903289 Free PMC article. Review.
-
A framework for elucidating regulatory networks based on prior information and expression data.Ann N Y Acad Sci. 2007 Dec;1115:240-8. doi: 10.1196/annals.1407.002. Epub 2007 Oct 9. Ann N Y Acad Sci. 2007. PMID: 17925352
-
Molecular networks in microarray analysis.J Bioinform Comput Biol. 2007 Apr;5(2B):429-56. doi: 10.1142/s0219720007002795. J Bioinform Comput Biol. 2007. PMID: 17636854 Review.
-
Network constrained clustering for gene microarray data.Bioinformatics. 2005 Nov 1;21(21):4014-20. doi: 10.1093/bioinformatics/bti655. Epub 2005 Sep 1. Bioinformatics. 2005. PMID: 16141248
Cited by
-
Identification of macrophage genes responsive to extracellular acidification.Inflamm Res. 2013 Apr;62(4):399-406. doi: 10.1007/s00011-013-0591-6. Epub 2013 Feb 16. Inflamm Res. 2013. PMID: 23417272
-
Network quantitative trait loci mapping of circadian clock outputs identifies metabolic pathway-to-clock linkages in Arabidopsis.Plant Cell. 2011 Feb;23(2):471-85. doi: 10.1105/tpc.110.082065. Epub 2011 Feb 22. Plant Cell. 2011. PMID: 21343415 Free PMC article.
-
SelexGLM differentiates androgen and glucocorticoid receptor DNA-binding preference over an extended binding site.Genome Res. 2018 Jan;28(1):111-121. doi: 10.1101/gr.222844.117. Epub 2017 Dec 1. Genome Res. 2018. PMID: 29196557 Free PMC article.
-
Finding the right questions: exploratory pathway analysis to enhance biological discovery in large datasets.PLoS Biol. 2010 Aug 31;8(8):e1000472. doi: 10.1371/journal.pbio.1000472. PLoS Biol. 2010. PMID: 20824171 Free PMC article.
-
Capturing changes in gene expression dynamics by gene set differential coordination analysis.Genomics. 2011 Dec;98(6):469-77. doi: 10.1016/j.ygeno.2011.09.001. Epub 2011 Sep 24. Genomics. 2011. PMID: 21971296 Free PMC article.
References
-
- Segal E, Shapira M, Regev A, Pe'er D, Botstein D, Koller D, Friedman N. Module networks: identifying regulatory modules and their condition-specific regulators from gene expression data. Nat Genet. 2003;8(2):166–176. http://dx.doi.org/10.1038/ng1165 - DOI - PubMed
-
- Friedman N. Inferring cellular networks using probabilistic graphical models. Science. 2004;8(5659):799–805. doi: 10.1126/science.1094068. http://dx.doi.org/10.1126/science.1094068 - DOI - DOI - PubMed
-
- Middendorf M, Kundaje A, Wiggins C, Freund Y, Leslie C. Predicting genetic regulatory response using classification. Bioinformatics. 2004;8(Suppl 1):I232–I240. doi: 10.1093/bioinformatics/bth923. http://dx.doi.org/10.1093/bioinformatics/bth923 - DOI - DOI - PubMed
Publication types
MeSH terms
Substances
Grants and funding
LinkOut - more resources
Full Text Sources
Other Literature Sources
