. 2007 Dec 7;249(3):487-99.
doi: 10.1016/j.jtbi.2007.08.011. Epub 2007 Aug 25.

Modeling antibiotic resistance in hospitals: the impact of minimizing treatment duration

Affiliations

Modeling antibiotic resistance in hospitals: the impact of minimizing treatment duration

Erika M C D'Agata et al. J Theor Biol. .

Abstract

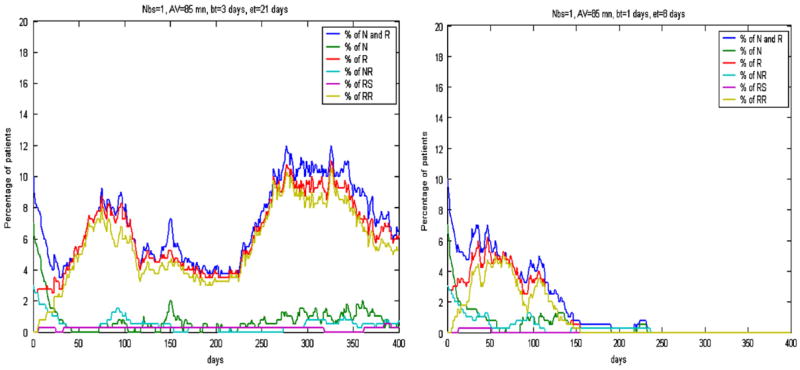
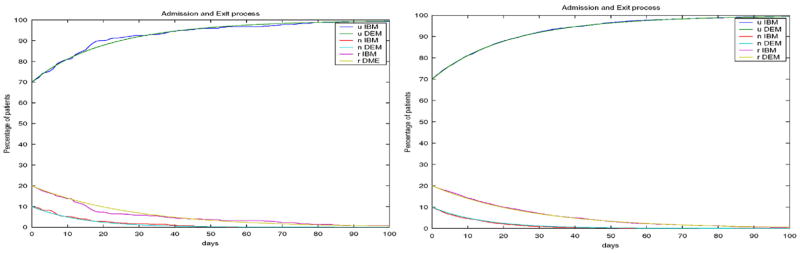
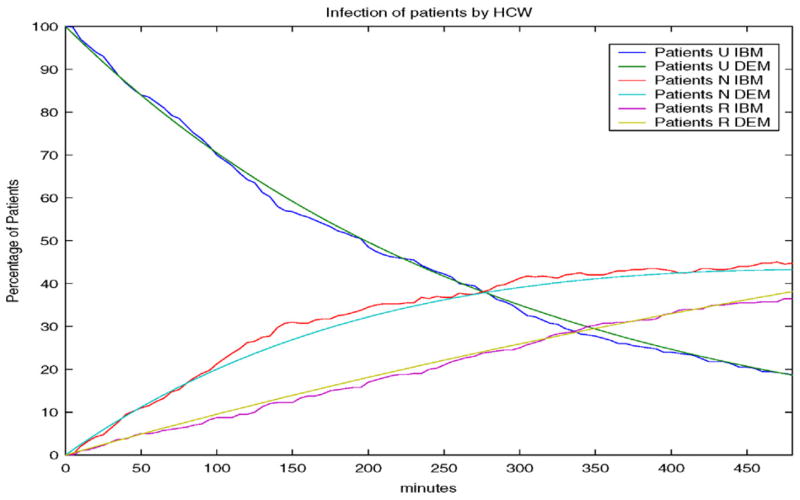
Infections caused by antibiotic-resistant pathogens are a global public health problem. Numerous individual- and population-level factors contribute to the emergence and spread of these pathogens. An individual-based model (IBM), formulated as a system of stochastically determined events, was developed to describe the complexities of the transmission dynamics of antibiotic-resistant bacteria. To simplify the interpretation and application of the model's conclusions, a corresponding deterministic model was created, which describes the average behavior of the IBM over a large number of simulations. The integration of these two model systems provides a quantitative analysis of the emergence and spread of antibiotic-resistant bacteria, and demonstrates that early initiation of treatment and minimization of its duration mitigates antibiotic resistance epidemics in hospitals.


Figures

Fig. 1
Fig. 1
Patient–HCW contact diagram for four patients and one HCW during one shift. Patient status: uninfected (green), infected with the non-resistant strain (yellow), infected with the resistant strain (red). HCW status: uncontaminated (______ ), contaminated with the non-resistant strain (... ... ...), contaminated with the resistant strain (- - - - -).
Fig. 2
Fig. 2
Flux diagram for HCW (top) and patients (bottom).
Fig. 3
Fig. 3
Infectiousness periods when the antibiotic treatment starts on day 3 and stops on day 21 (inoculation occurs on day 0). The blue and red curves represent, respectively, the bacterial load of resistant and non-resistant bacteria during the period of infection. The green horizontal lines represent the threshold of infectiousness TH = 1011. The green bars represent the treatment period. The yellow, red, and orange bars represent the periods of infectiousness for the non-resistant, resistant, and both non-resistant and resistant classes, respectively.
Fig. 4
Fig. 4
Simulation of the IBM over 1 year, when (left) treatment starts on day 3 and stops on day 21, and (right) treatment starts on day 1 and stops on day 8. In the former case the resistant strain becomes endemic and in the latter case both strains are eliminated. All parameters have baseline values as in Table 1.
Fig. 5
Fig. 5
Numerical simulation of the IBM (left) and the deterministic model (right) over 1 year, when the treatment starts on day 3 and stops on day 21, and AV = 60 min. All other parameters are at baseline. In the IBM the time step for stochastic events is Δt = 5 min.
Fig. 6
Fig. 6
The deterministic model over 3 years, when (left) treatment starts on day 3 and stops on day 21, and (right) treatment starts on day 1 and stops on day 8. In the former case the resistant strain becomes endemic and in the latter case both strains are eliminated, as in Fig. 4.
Fig. 7
Fig. 7
The basic reproductive numbers R0N and R0R as functions of the beginning of treatment and the length of treatment. R0N increases as the beginning day of treatment increases and decreases as the length of the treatment period increases, whereas R0R increases with both. All other parameters have baseline values.
Fig. 8
Fig. 8
The basic reproductive numbers R0N and R0R as functions of the average time of visit AV and the average time of contamination of healthcare workers AC.
Fig. 9
Fig. 9
The left (respectively the right) figure represents the IBM and DEM over 100 days for 1 simulation (respectively the average over 10 trajectories) with the patient population held constant and with no new infections. Parameters are as in Table 1. Since no new infections occur, the uninfected class fraction approaches 100% and both infected class fractions approach 0%.
Fig. 10
Fig. 10
The left (respectively the right) figure corresponds to 1 trajectory (respectively the average over 80 trajectories) of the IBM during one shift, with no exit and admission of patients, and no changes in the infection status of patients. Here Δt = 0.00347 days, AV = AC = 0.042 days, PNI=0.2,PNRI=0.3,PRI=0.4.
Fig. 11
Fig. 11
A numerical simulation of the IBM and the DEM over one shift, assuming no admission and exit of patients and no change in HCW contamination status, with AC = 0.042 days, AV = 0.021 days, PI = 0.6, HN = 50%, HNR = 0%, HR = 20%.

References

    1. Anderson RM, May RM. Infectious Diseases of Humans: Dynamics and Control. Oxford University Press; Oxford: 1991.
    1. Austin DJ, Bonten MJM, Weinstein RA, Slaughter S, Anderson RM. Vancomycin-resistant enterococci in intensive-care hospital settings: transmission dynamics, persistence, and the impact of infection control programs. Proc Natl Acad Sci USA. 1999;96:6908–6913. - PMC - PubMed
    1. Avorn J, Solomon DH. Cultural and economic factors that (mis)shape antibiotic use: the nonpharmacologic basis of therapeutics. Ann Int Med. 2000;133:128–135. - PubMed
    1. Bonhoeffer S, Liptsitch M, Levin BR. Evaluating treatment protocols to prevent antibiotic resistance. Proc Natl Acad Sci USA. 1997;94:12106–12111. - PMC - PubMed
    1. Bonten MJM, Willems R, Weinstein RA. Vancomycin-resistant enterococci: why are they here, and where do they come from? Lancet Infect Dis. 2001;1:314–325. - PubMed

Publication types

MeSH terms

Substances