. 2008 Feb 1;94(3):1063-74.
doi: 10.1529/biophysj.107.114702. Epub 2007 Sep 28.

Reversal of cell polarity and actin-myosin cytoskeleton reorganization under mechanical and chemical stimulation

Affiliations

Reversal of cell polarity and actin-myosin cytoskeleton reorganization under mechanical and chemical stimulation

Jérémie Dalous et al. Biophys J. .

Abstract

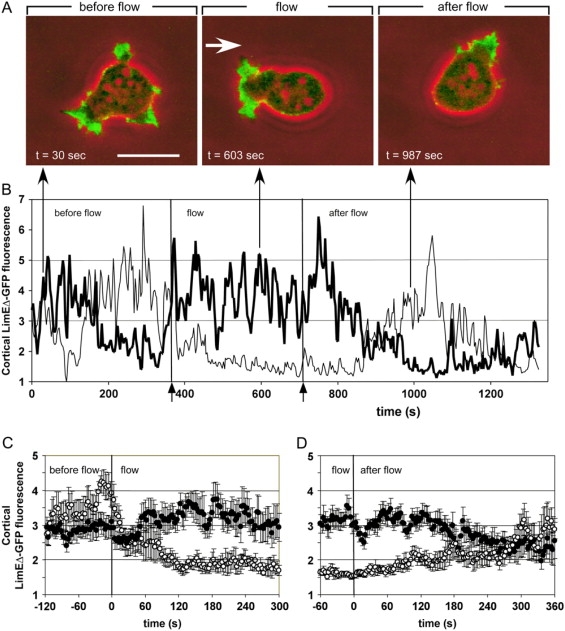
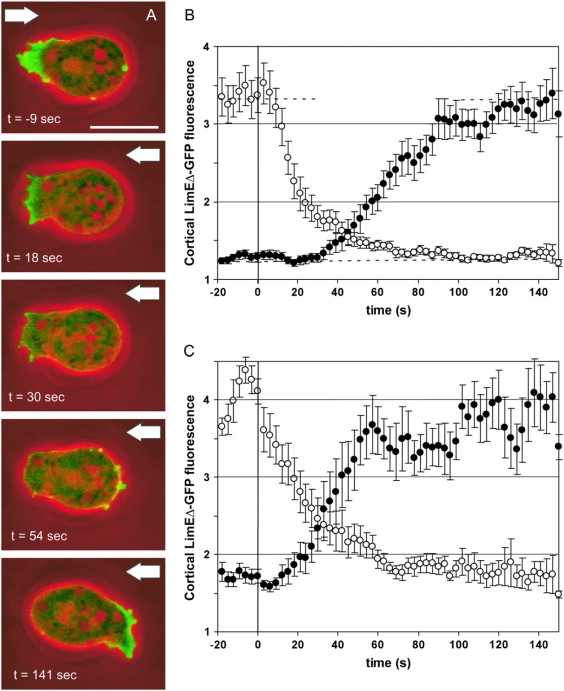
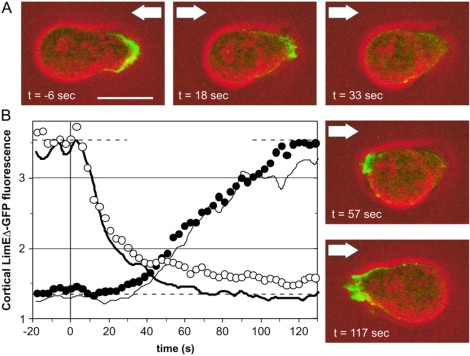
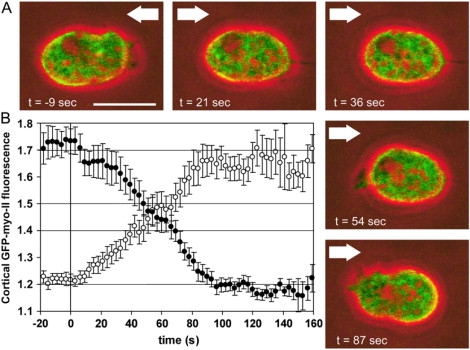
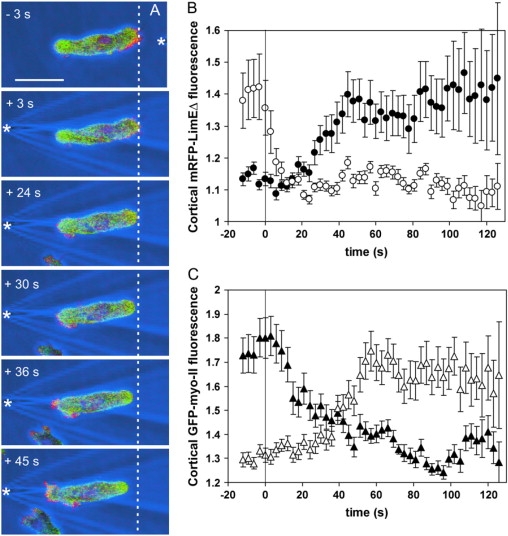
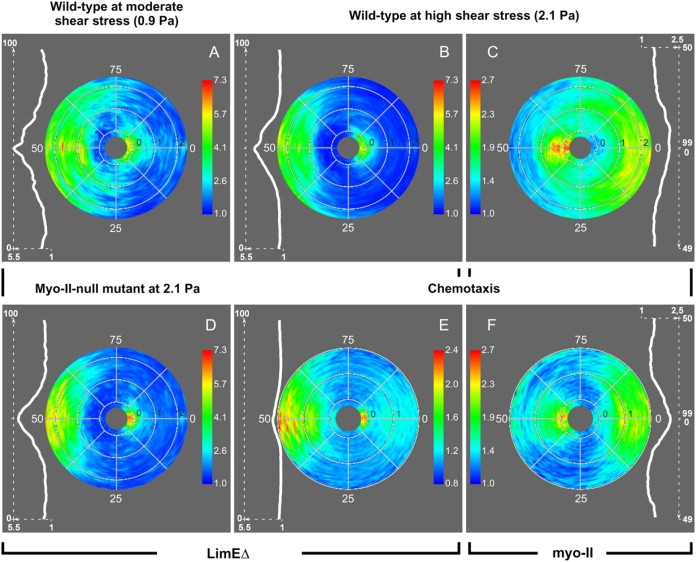
To study reorganization of the actin system in cells that invert their polarity, we stimulated Dictyostelium cells by mechanical forces from alternating directions. The cells oriented in a fluid flow by establishing a protruding front directed against the flow and a retracting tail. Labels for polymerized actin and filamentous myosin-II marked front and tail. At 2.1 Pa, actin first disassembled at the previous front before it began to polymerize at the newly induced front. In contrast, myosin-II slowly disappeared from the previous tail and continuously redistributed to the new tail. Front specification was myosin-II independent and accumulation of polymerized actin was even more focused in mutants lacking myosin-II heavy chains. We conclude that under mechanical stimulation, the inversion of cell polarity is initiated by a global internal signal that turns down actin polymerization in the entire cell. It is thought to be elicited at the most strongly stimulated site of the cell, the incipient front region, and to be counterbalanced by a slowly generated, short-range signal that locally activates actin polymerization at the front. Similar pattern of front and tail interconversion were observed in cells reorienting in strong gradients of the chemoattractant cyclic AMP.


Figures

Figure 1
Figure 1
Contour analysis used to determine the distribution of a protein in the cortex relative to the interior of a cell. Here the distribution of fluorescence intensities of LimEΔ-GFP in a confocal section is used as an example. The cell contour is drawn in dashed and solid lines for the left and right half of the cell, respectively. Numbers indicate node positions along the cell outline. The inner solid white line encircles the cell interior.
Figure 2
Figure 2
Reversible cell polarization under shear stress. (A) In a cell of the JH10 (“wild-type”) strain of D. discoideum, filamentous actin is visualized by the expression of LimEΔ-GFP (green fluorescence superimposed on phase-contrast images in red). In response to a hydrodynamic flow stress of σ = 2.1 Pa the cell becomes polarized, pointing an actin-enriched front against the direction of the flow (indicated by an arrow). The same cell is shown in Supplementary movie 1. Bar, 10 μm. (B) Cortical fluorescence intensities are quantified and plotted separately for the left (bold line) and right (faint line) halves of the cell shown in panel A. (For image analysis see Materials and Methods). In the absence of flow, fluorescence intensities fluctuate in both halves, owing to fronts protruded by the cell in arbitrary directions. Systematically higher values in the left than in the right half indicate polarization of the cell against the flow. After cessation of the flow, the cell slowly reverts from directional to random movement. Arrows on the bottom confine the period of flow application from 375 to 705 s. Arrows on top specify the time points at which the three frames of panel A have been taken. (C and D) Averages of cortical fluorescence intensities in cells exposed to the onset (C) or cessation (D) of flow. Solid circles correspond to upstream halves and open circles to downstream halves of the cells. For panel C, 11 polarization experiments on eight cells are averaged, for panel D, 13 depolarization experiments on nine cells. Error bars indicate mean ± SE.
Figure 3
Figure 3
Actin relocalization after flow reversal. The responses of cells exposed to a rapid reversal in flow direction are monitored. High hydrodynamic shear stress of σ = 2.1 Pa (A and B) or moderate shear stress of σ = 0.9 Pa (C) has been applied. As in Fig. 2, filamentous actin is visualized in wild-type cells expressing LimEΔ-GFP. (A) Sequence of images showing the change in LimEΔ-GFP localization during the response of a cell. (Green) LimEΔ-GFP fluorescence; (red) phase contrast. Arrows point to the actual flow direction. The same cell is shown in Supplementary movie 2. Bar, 10 μm. (B and C) Quantification of the responses to high and moderate shear stress. Solid circles indicate mean intensities of cortical fluorescence in halves of the cells that are upstream after flow reversal, and open circles in those that are downstream. Zero time is the time of flow reversal. Dashed horizontal lines in panel B indicate the fluorescence at steady state in each half of the cells. For panel B, 18 responses of 14 cells are averaged; for panel C, 10 responses of five cells. Error bars indicate mean ± SE.
Figure 4
Figure 4
The absence of myo-II does not impair actin relocalization after flow reversal. Experiments as shown in Fig. 3, A and B, are repeated with myo-II-null cells of strain HS1 that express LimEΔ-GFP. Time is expressed in seconds relative to the reversal of a hydrodynamic shear stress of σ = 2.1 Pa. (A) Sequence of images showing the distribution of LimEΔ-GFP in a myo-II-null cell before and after flow reversal (see also Supplementary movie 4). (Green) LimEΔ-GFP fluorescence; (red) phase contrast. Arrows indicate the flow direction. Bar, 10 μm. (B) Quantification of the responses relative to the time of flow reversal. Solid circles correspond to cortical fluorescence intensities in the upstream halves and open circles in the downstream halves of the cells. Dashed lines indicate cortical intensities at steady state in the two halves of the cells. For comparison, the distribution of LimEΔ-GFP in the cortex of parental JH10 cells is shown for the upstream or downstream halves of the cells as a faint or bold line, according to data presented in Fig. 3 B. Twenty-two responses recorded from 14 cells are averaged.
Figure 5
Figure 5
Relocalization of GFP-myo-II after flow reversal. GFP-myo-II expressing cells are monitored during reversal of a hydrodynamic shear stress of σ = 2.1 Pa. Time is expressed in seconds relative to flow reversal. (A) Sequence of images showing GFP-myo-II relocalization in a HS1 cell (see also Supplementary movie 5). (Green) GFP-myo-II fluorescence; (red) phase contrast. Arrows point into the flow direction. (B) Quantification of GFP-myo-II relocalization in the cell cortex. Solid circles correspond to the upstream halves of the cells and open circles to the downstream halves. Data are pooled from JH10 wild-type and HS1 myo-II-null cells, both expressing GFP-myo-II. Twenty responses recorded from 14 cells are averaged. Error bars indicate mean ± SE.
Figure 6
Figure 6
Actin and myo-II relocalization after flow reversal. To monitor the relocalization of myo-II and actin simultaneously in the same cell, the endogenous myo-II heavy chains were replaced by GFP-tagged heavy chains, and mRFP-LimEΔ was expressed as an actin label. The cells were exposed to a rapid change in the direction of a hydrodynamic shear stress of σ = 2.1 Pa. Time is expressed in seconds before and after flow reversal. (A) Sequence of images showing the distribution of GFP-myo-II and mRFP-LimEΔ (see also the same cell in Supplementary movie 6). (Green) GFP-myo-II; (red) mRFP-LimEΔ; (blue) phase contrast. Arrows point into the flow direction. The white dotted line indicates the position where the previous front is turned into a tail. Bar, 10 μm. (B and C) Quantification of mRFP-LimEΔ localization (B) and GFP-myo-II redistribution (C) relative to the time of flow reversal. Solid symbols correspond to the upstream halves of the cells and open symbols to the downstream halves. The continuous line in panel C shows the mean position of the downstream edge as a function of time. Thirteen responses recorded from 10 cells are averaged. Error bars indicate mean ± SE.
Figure 7
Figure 7
Actin and myo-II relocalization after reversal of a gradient of chemoattractant. To relate reversal of cell polarity in response to chemoattractant to the reversal caused by shear stress, double-labeled cells as in Fig. 6 were stimulated with a micropipette filled with cAMP. The pipette was rapidly moved from the front to the back of a cell. Time in seconds is indicated relative to repositioning of the pipette. (A) Sequence of images showing the distributions of mRFP-LimEΔ and GFP-myo-II in a responding cell. (Green) GFP-myo-II; (red) mRFP-LimEΔ; (blue) phase contrast. White asterisks indicate tip positions of the micropipette filled with cAMP. The white dotted line indicates the rightmost position of the later cell rear. The same cell is shown in Supplementary movie 7. Bar, 10 μm. (B and C) Quantification of mRFP-LimEΔ localization (B) and GFP-myo-II redistribution (C). Solid symbols correspond to the upstream halves of the cells and open symbols to the downstream halves. Nineteen responses recorded from 14 cells are averaged. Error bars indicate mean ± SE.
Figure 8
Figure 8
Spatiotemporal patterns of actin and myo-II relocalization in cells reverting their polarity in response to mechanical or chemical stimuli. These patterns are represented in polar plots that show the distribution of cortical fluorescence intensities in optical sections through the cells. In each plot the radius corresponds to time, from 15 s before signal reversal to 2.0–2.5 min after the reversal. The black numbers indicate time in minutes plotted in outward direction. The data sets are based on the same recordings as compiled in Figs. 3–7, whereby fluorescent LimEΔ serves as a marker of the front and myo-II of the tail of a cell. The color index indicates normalized cortical fluorescence intensities. (For their calculation, see Materials and Methods.) Nodes 0 correspond to the previous direction of a stimulus and nodes 50 to the new direction, i.e., the one after flow reversal or repositioning of the source of chemoattractant. The white curves on the left or right of each plot show distributions of fluorescence intensities in responding cells, as averaged over the interval of 1–2 min after signal reversal. For the LimEΔ label, the distributions along the cell contour are centered to node number 50 in accord with accumulation of this label at the new front. For myo-II the distributions are centered to node number 0 in accord with its recruitment to the new tail. Standard deviations of these distributions are 12.7 nodes for A, 10.0 for B, 16.2 for C, 8.8 for D, 7.2 for E, and 9.4 nodes for F. (Note the difference in scaling of cortical fluorescence intensities from 1 to 5.5 for LimEΔ and from 1 to 2.5 for myo-II.) Data in panels A and B on the front marker in wild-type JH10 cells exposed to moderate and high shear stress correspond to Fig. 3, C and B. Data in panel C on the tail marker correspond to Fig. 5. Data in panel D on the front response in HS1 myo-II-null cells correspond to Fig. 4. Data in panels E and F on double-labeled cells correspond to Fig. 7.

References

    1. Hardin J., Walston T. Models of morphogenesis: the mechanisms and mechanics of cell rearrangement. Curr. Opin. Genet. Dev. 2004;14:399–406. - PubMed
    1. Dormann D., Weijer C.J. Chemotactic cell movement during Dictyostelium development and gastrulation. Curr. Opin. Genet. Dev. 2006;16:367–373. - PubMed
    1. Blaser H., Reichman-Fried M., Castanon I., Dumstrei K., Marlow F., Kawakami K., Solnica-Krezel L., Heisenberg C., Raz E. Migration of zebrafish primordial germ cells: a role for myosin contraction and cytoplasmic flow. Dev. Cell. 2006;11:613–627. - PubMed
    1. Gerisch G. Chemotaxis in Dictyostelium. Annu. Rev. Physiol. 1982;44:535–552. - PubMed
    1. Weber I., Wallraff E., Albrecht R., Gerisch G. Motility and substratum adhesion of Dictyostelium wild-type and cytoskeletal mutant cells: a study by RICM/bright-field double-view image analysis. J. Cell Sci. 1995;108:1519–1530. - PubMed

Publication types

LinkOut - more resources