. 2007 Nov;145(3):747-62.
doi: 10.1104/pp.107.104422. Epub 2007 Sep 28.

Global expression profiling applied to the analysis of Arabidopsis stamen development

Affiliations

Global expression profiling applied to the analysis of Arabidopsis stamen development

Márcio Alves-Ferreira et al. Plant Physiol. 2007 Nov.

Abstract

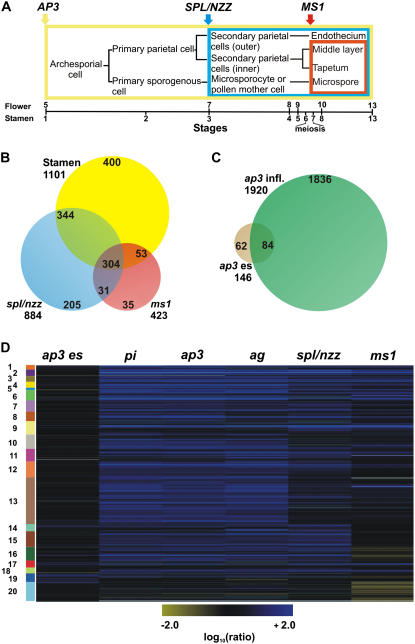
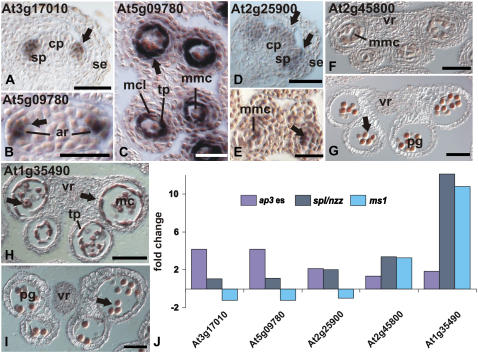
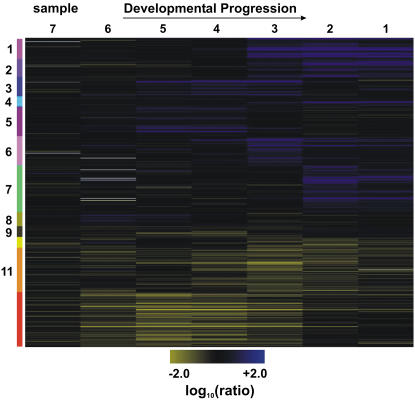
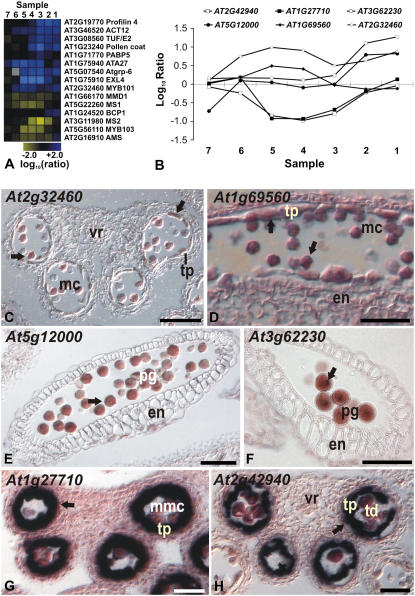
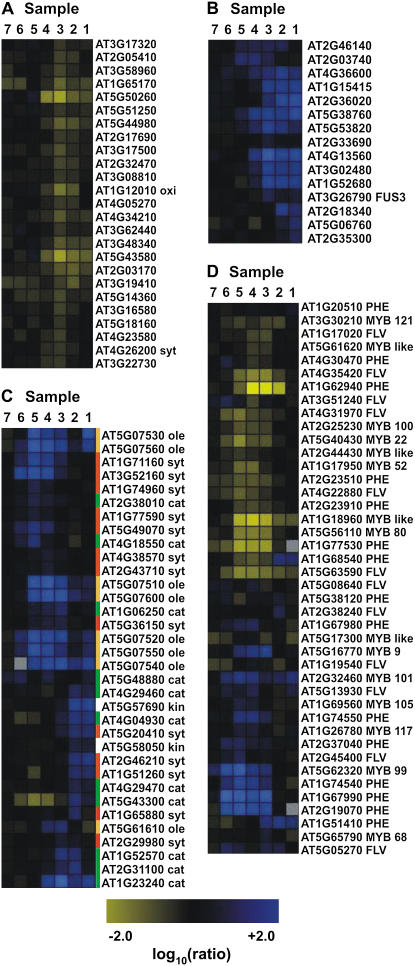
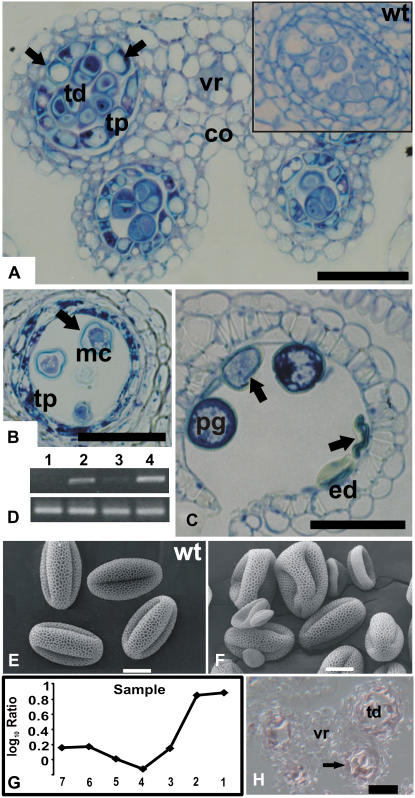
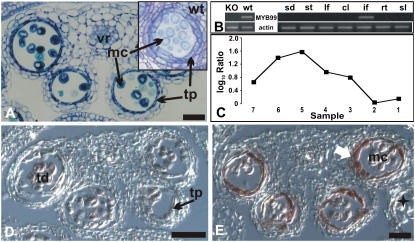
To obtain detailed information about gene expression during stamen development in Arabidopsis (Arabidopsis thaliana), we compared, by microarray analysis, the gene expression profile of wild-type inflorescences to those of the floral mutants apetala3, sporocyteless/nozzle, and male sterile1 (ms1), in which different aspects of stamen formation are disrupted. These experiments led to the identification of groups of genes with predicted expression at early, intermediate, and late stages of stamen development. Validation experiments using in situ hybridization confirmed the predicted expression patterns. Additional experiments aimed at characterizing gene expression specifically during microspore formation. To this end, we compared the gene expression profiles of wild-type flowers of distinct developmental stages to those of the ms1 mutant. Computational analysis of the datasets derived from this experiment led to the identification of genes that are likely involved in the control of key developmental processes during microsporogenesis. We also identified a large number of genes whose expression is prolonged in ms1 mutant flowers compared to the wild type. This result suggests that MS1, which encodes a putative transcriptional regulator, is involved in the stage-specific repression of these genes. Lastly, we applied reverse genetics to characterize several of the genes identified in the microarray experiments and uncovered novel regulators of microsporogenesis, including the transcription factor MYB99 and a putative phosphatidylinositol 4-kinase.


Figures

Figure 1.
Figure 1.
Experimental design and microarray results. A, Diagram depicting cell lineages during wild-type anther development. The colored boxes enclose the tissues or cell types affected in the different mutants included in the analysis. The bar below the diagram shows stages of flower and anther development described by Smyth et al. (1990) and Sanders et al. (1999), respectively. B, A Venn diagram indicates the overlap between genes identified as down-regulated in the ms1 and spl/nzz experiments and genes with predicted expression in stamens (Wellmer et al., 2004; see “Materials and Methods” for details). C, A Venn diagram depicts the overlap between genes identified as differentially expressed in whole inflorescences of ap3 mutant flowers (ap3 infl.; Wellmer et al., 2004) and genes that showed significant expression changes in young floral buds of ap3 mutants (ap3 es) relative to the wild type. D, Self-organizing map for 1,545 genes that either showed differential expression in the ap3 es, spl/nzz, or ms1 experiments or were predicted as specifically or predominantly expressed in stamens (see above). Microarray data from the analyses of gene expression in ag, pi, and ap3 inflorescences (Wellmer et al., 2004) were also included in the cluster analysis. Genes that are down-regulated in a mutant compared to the wild type are depicted in blue and up-regulated genes in yellow. Expression ratios and FC values refer to wild-type/mutant comparisons (Supplemental Table S1); thus, a positive ratio and FC value corresponds to down-regulation in the mutant and, conversely, a negative ratio to up-regulation. The intensities of the colors increase with increasing expression differences as indicated at the bottom. The diagram was generated with the program Rosetta Resolver using log10-transformed expression ratios. Numbered and colored bars on the left indicate distinct clusters of genes (see Supplemental Table S2 for details).
Figure 2.
Figure 2.
Microarray data and expression patterns of selected genes. A to I, Expression patterns were analyzed in wild-type flowers by in situ hybridization. A, B, and D, Longitudinal sections are shown. For all others, transverse sections were used. Arrows indicate regions of expression. A, Expression of At3g17010, encoding a B3 domain-containing protein, in emerging stamen primordia at floral stage 6. B and C, Expression of At5g09780, which encodes another B3 domain-containing protein. At floral stage 7, expression was first observed in subepidermal cells of stamen primordia from which archesporial cells are derived (B). At floral stage 8, expression was detected in tapetal cells and in the middle cell layer (C). At this stage, the expression of At3g17010 overlaps with that of At5g09780 (not shown). D, Expression of At2g25900, encoding a zinc finger-containing protein, in stamen and carpel primordia was first observed in stage 6 floral buds. E, At floral stage 8, expression was found in microspore mother cells, the tapetum, and the middle cell layer. F and G, Expression of At2g45800, which codes for a NtLIM1-like protein, in the tapetum and in microspores of floral buds at stages 9 and 10, respectively. H and I, Expression of At1g35490, which encodes a bZIP transcription factor, is strong in the tapetum and in microspores at late floral stage 9 (H) and is restricted to microspores after tapetum degeneration at late stage 10 (I). J, FC values derived from the individual microarray experiments (as indicated) are shown for the genes described above. A positive FC value corresponds to down-regulation in the mutant and, conversely, a negative FC value to up-regulation. ar, Archesporial cell; cp, carpel primordium; mmc, microspore mother cell; mcl, middle cell layer; pg, pollen grain; se, sepal; sp, stamen primordium; ta, tapetum; vr, vascular region. Scale bars = 50 μm (A, D, G–I) and 25 μm (B, C, E, and F).
Figure 3.
Figure 3.
Progression of gene expression in developing anthers of ms1 mutant flowers. A, Self-organizing map for 1,516 genes with significant expression changes in ms1 mutant flowers compared to the wild type at different stages of development. Tissue samples were collected as outlined in “Materials and Methods.” Genes that are down-regulated in ms1 mutant flowers compared to the wild type are depicted in blue and up-regulated genes in yellow. The intensities of the colors increase with increasing expression differences as indicated on the bottom. The diagram was generated with the program Rosetta Resolver using log10-transformed expression ratios. Numbered and colored bars on the left indicate distinct clusters of genes used for further functional analysis (see text for details).
Figure 4.
Figure 4.
Microarray data and results of in situ hybridizations for selected genes whose expression is affected in ms1 mutant flowers. A, Stage-specific effects of MS1 on the expression of selected genes with previously characterized expression patterns. The diagram was generated as outlined for Figure 3. B, Log10-transformed expression ratios from the analysis of individual tissue samples (as indicated) are shown for the genes described below. C to H, Result of in situ hybridization experiments for selected genes. Arrows indicate regions of expression. C and D, MYB101 (At2g32460) and MYB105 (At1g69560) are expressed in pollen grains and in the tapetum. Transverse (C) and longitudinal (D) sections through anthers of stages 11 and 9, respectively, are shown. E, At5g12000, encoding a protein kinase, is expressed exclusively in mature pollen grains. A longitudinal section through a stage 12 anther is shown. F, Expression of At3g62230, encoding an F-box protein, was observed in germinative cells of mature pollen grains. A longitudinal section through a stage 12 anther is shown. G, The expression of At1g27710, which encodes a Gly-rich protein, is exclusively observed in tapetal cells. H, Expression of At2g42940, which encodes an AT-hook DNA-binding protein, was found in the tapetum after the completion of meiosis. Note that this gene has a very narrow window of expression during tapetum development similar to that of At1g27710. G and H, Transverse sections through anthers of stage 8 and 7, respectively. en, Endothecium; mc, microspore; mmc, microspore mother cell; pg, pollen grain; td, tetrads; tp, tapetum; vr, vascular region. Scale bars = 50 μm (C and E) and 25 μm (D, F, and G).
Figure 5.
Figure 5.
Expression of selected functionally related genes throughout anther development as derived from the ms1 experiments. Grouping of the genes was done with Rosetta Resolver using an agglomerative hierarchical clustering algorithm and Pearson correlation as a proximity measure. Genes that are down-regulated in the mutant compared to the wild type are depicted in blue and up-regulated genes in yellow. The intensities of the colors increase with increasing expression differences, as indicated at the bottom. A, Genes involved in protein degradation or ethylene biosynthesis. B, LEA genes and genes involved in GA response. C, Genes involved in lipid metabolism or storage. Three distinct sets of genes involved in different aspects of lipid metabolism are shown. Genes involved in lipid synthesis (red bars) are predominantly repressed in samples 6, 5, and 4; oleosin-like genes (orange bars), which are required for lipid storage, are repressed in samples 5, 4, and 3; and most of the genes that mediate lipid catabolism (green bar) are down-regulated in samples 3, 2, and 1. D, Genes encoding MYB transcription factors and genes involved in phenylpropanoid metabolism. cat, Catabolism; des, desaturase; FLV, genes involved in flavonoid synthesis; kin, kinase; ole, oleosin; PHE, genes involved in the synthesis of phenolic compounds; syt, synthesis. Annotation of MYB or MYB-like genes is based on Larkin et al. (2003).
Figure 6.
Figure 6.
Characterization of a T-DNA insertion line for gene At2g40850. A to C, Transverse sections through mutant anthers. The sections were stained with toluidine blue and then photographed using bright-field microscopy. A, Section through a stage 6 mutant anther. Inset shows a section through a locule from a wild-type plant at the same developmental stage. Note the abnormally enlarged vacuoles of tapetal cells in the mutant (arrows). Representative images are shown of multiple sections of mutant and wild-type anthers that were analyzed. B and C, Sections through mutant anthers at stage 11 (B) and at stage 12 (C) after breakage of the septum. Note the collapsed pollen grains (marked by arrows). D, Effect of the T-DNA insertion on At2g40850 expression. Top, Gene-specific primers for At2g40850 were used for RT-PCR; bottom, primers for actin were used as a control to verify that roughly the same amount of cDNA was used in the different reactions. RNA was isolated from the following tissues: whole inflorescences of plants mutant for At2g40850 (lane 1); flower buds of wild-type plants that were smaller (lane 2) or larger (lane 3) than 0.5 mm; whole inflorescences of wild-type plants (lane 4). E and F, Scanning electron micrographs of pollen grains from wild-type plants (E) and from the mutant line for At2g40850 (F). Microarray data for At2g40850. G, Log10-transformed ratios from the analysis of temporal gene expression in ms1 mutant flowers are shown. At2g40850 showed two distinct peaks of expression, one at an early stage of stamen development and a second at later stages, when mature pollen grains are formed. H, Result of in situ hybridization for At2g40850. A transverse section through a stage 7 anther is shown. A weak hybridization signal was obtained in tapetum and tetrads (arrow). co, Connective; ed, endothecium; mc, microspore; pg, pollen grain; tp, tapetum; tetrads, td; vr, vascular region. Scale bars = 30 μm (A, B, C, and H) and 10 μm (E and F).
Figure 7.
Figure 7.
Characterization of a T-DNA insertion line for MYB99. A, Transverse section through a myb99 mutant anther. Cells are morphologically similar to their counterparts in wild-type anthers (see inset), with the exception of tapetal cells at the vacuolated microspore stage. A representative image is shown of multiple sections of mutant and wild-type anthers that were analyzed. B, MYB99 expression in distinct organs or tissues (sd, Seedling; st, mature stamen; lf, leaf; cl, cauline leaf; if, inflorescence; rt, roots; sl, siliques) of wild-type plants (right) and in whole inflorescences of the myb99 mutant line (KO) compared to the wild type (wt; left). Top, Gene-specific primers for MYB99 were used for RT-PCR; bottom, primers for actin were used as a control to verify that a similar amount of cDNA was used in the different reactions. MYB99 transcripts were only detected in inflorescences. C, Microarray data for MYB99. Log10-transformed ratios from the analysis of temporal gene expression in ms1 mutant flowers are shown. MYB99 expression peaks at early stages of stamen development. D and E, Results of in situ hybridizations for MYB99. D, Transverse section through a stage 7 anther. Only weak hybridization signals were obtained. E, Transverse section of an anther at stage 9 showing expression of MYB99 exclusively in the tapetum (arrow). A star indicates a lateral anther at a later stage of flower development, in which MYB99 expression was not detectable in the tapetum. mc, Microspores; pg, pollen grain; tp, tapetum; td, tetrads; vr, vascular region. Scale bars = 30 μm.

References

    1. Aarts MGM, Hodge R, Kalantidis K, Florack D, Wilson ZA, Mulligan BJ, Stiekema WJ, Scott R, Pereira A (1997) The Arabidopsis MALE STERILITY 2 protein shares similarity with reductases in elongation/condensation complexes. Plant J 12 615–623 - PubMed
    1. Albrecht C, Russinova E, Hecht V, Baaijens E, de Vries S (2005) The Arabidopsis thaliana SOMATIC EMBRYOGENESIS RECEPTOR-LIKE KINASES1 and 2 control male sporogenesis. Plant Cell 17 3337–3349 - PMC - PubMed
    1. Alonso JM, Stepanova AN, Leisse TJ, Kim CJ, Chen HM, Shinn P, Stevenson DK, Zimmerman J, Barajas P, Cheuk R, et al (2003) Genome-wide insertional mutagenesis of Arabidopsis thaliana. Science 301 653–657 - PubMed
    1. Amagai M, Ariizumi T, Endo M, Hatakeyama K, Kuwata C, Shibata D, Toriyama K, Watanabe M (2003) Identification of anther-specific genes in a cruciferous model plant, Arabidopsis thaliana, by using a combination of Arabidopsis macroarray and mRNA derived from Brassica oleracea. Sex Plant Reprod 15 213–220
    1. Ariizumi T, Hatakeyama K, Hinata K, Sato S, Kato T, Tabata S, Toriyama K (2005) The HKM gene, which is identical to the MS1 gene of Arabidopsis thaliana, is essential for primexine formation and exine pattern formation. Sex Plant Reprod 18 1–7

Publication types