. 2007 Dec;189(23):8405-16.
doi: 10.1128/JB.01038-07. Epub 2007 Sep 28.

The catabolite control protein CcpA binds to Pmga and influences expression of the virulence regulator Mga in the Group A streptococcus

Affiliations

The catabolite control protein CcpA binds to Pmga and influences expression of the virulence regulator Mga in the Group A streptococcus

Audry C Almengor et al. J Bacteriol. 2007 Dec.

Abstract

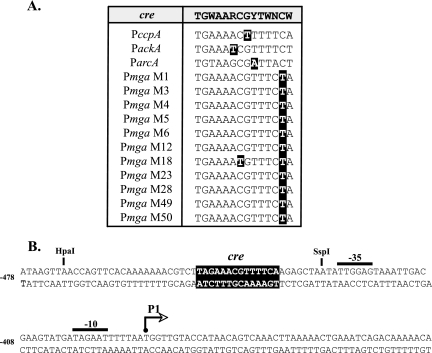
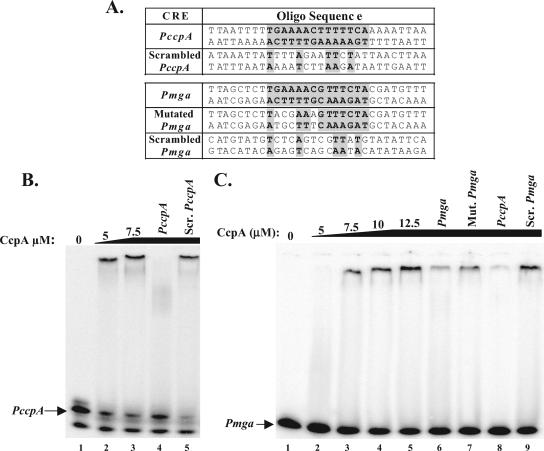
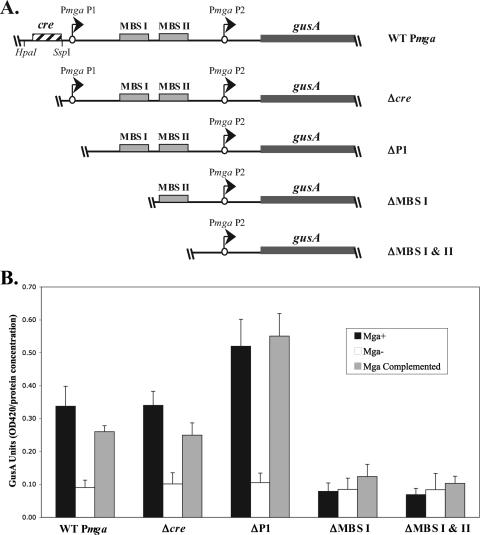
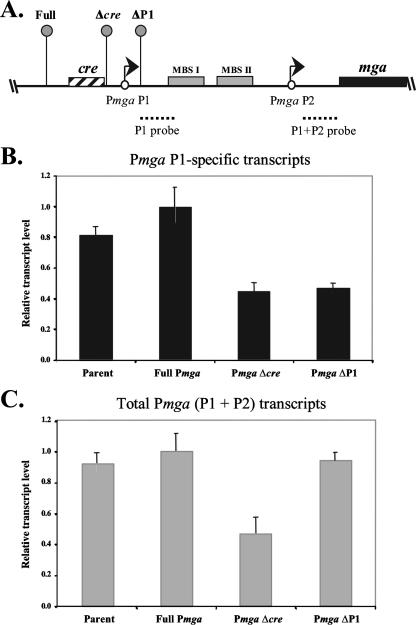
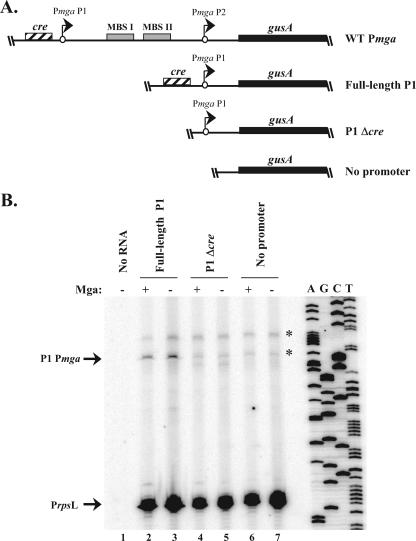
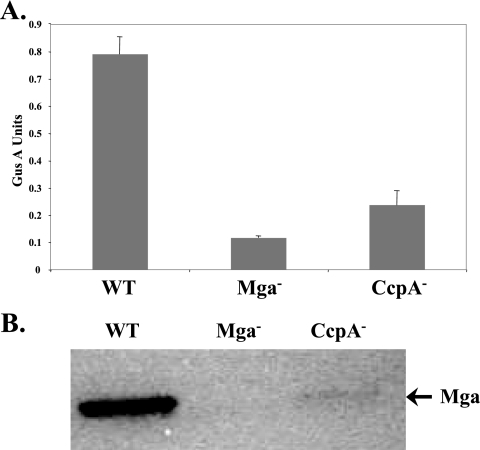
Carbon catabolite repression (CCR) allows bacteria to alter metabolism in response to the availability of specific sugar sources, and increasing evidence suggests that CCR is involved in regulating virulence gene expression in many pathogens. A scan of the M1 SF370 group A streptococcus (GAS) genome using a Bacillus subtilis consensus identified a number of potential catabolite-responsive elements (cre) important for binding by the catabolite control protein A (CcpA), a mediator of CCR in gram-positive bacteria. Intriguingly, a putative cre was identified in the promoter region of mga upstream of its distal P1 start of transcription. Electrophoretic mobility shift assays showed that a His-CcpA fusion protein was capable of binding specifically to the cre in Pmga in vitro. Deletion analysis of Pmga using single-copy Pmga-gusA reporter strains found that Pmga P1 and its upstream cre were not required for normal autoregulated mga expression from Pmga P2 as long as Mga was produced from its native locus. In fact, the Pmga P1 region appeared to show a negative influence on Pmga P2 in these studies. However, deletion of the cre at the native Pmga resulted in a reduction of total mga transcripts as determined by real-time reverse transcription-PCR, supporting a role for CcpA in initial expression. Furthermore, normal transcriptional initiation from the Pmga P1 start site alone was dependent on the presence of the cre. Importantly, inactivation of ccpA in the M6 GAS strain JRS4 resulted in a reduction in Pmga expression and Mga protein levels in late-logarithmic-phase cell growth. These data support a role for CcpA in the early activation of the mga promoter and establish a link between CCR and Mga regulation in the GAS.


Figures

FIG. 1.
FIG. 1.
Alignment of putative cre identified in GAS genomes. (A) Possible cre from the Pmga region in 11 different serotypes of the GAS as well as those identified in the promoters of known CcpA-regulated genes PccpA, PackA, and ParcA were aligned to the consensus B. subtilis cre (shaded at the top) used to identify them. Nucleotides that did not match the consensus are in black boxes. (B) Location of the putative Pmga cre (black box) relative to the P1 start of transcription in the M1 SF370 GAS genome. The P1 start of transcription (arrow), −10 and −35 hexamers (overlines), and relevant restriction sites are shown. The numbers at left reflect the position relative to the start codon for mga.
FIG. 2.
FIG. 2.
EMSA of Pmga cre using His-CcpA. (A) Sequence of annealed oligonucleotide (Oligo) probes used in EMSAs. Putative cre are indicated by shaded boxes. Base pairs matching Pmga cre are shaded and in boldface. EMSA was performed on radiolabeled PccpA-annealed (B) or (C) Pmga-annealed oligonucleotide probes. A constant amount (1 to 2 ng) of [γ-32P]ATP-labeled probe was incubated with increasing amounts (5 to 12.5 μM) of purified GAS His-CcpA for 30 min at 30°C prior to separation on a 5% polyacrylamide, 10% glycerol gel. The specificity of His-CcpA binding to Pmga was assayed by addition of 700 ng of unlabeled competitor annealed oligonucleotide probes corresponding to Pmga (lane 6), mutated (Mut.) Pmga (lane 7), PccpA (lanes 4 and 8), and scrambled (Scr.) PccpA (lane 5) or Pmga (lane 9) using the oligonucleotide pairs listed in Table 2.
FIG. 3.
FIG. 3.
VIT GusA transcriptional reporter assay for deletion analysis of Pmga. (A) Schematic representation of gusA transcriptional reporters in the chromosomal VIT locus of the M6 GAS corresponding to wild-type Pmga (KSM310), Δcre (KSM435), ΔP1 (KSM427), ΔMBS I (KSM428), and ΔMBS I & II (KSM429). The starts of transcription for mga (circles with arrows), the gusA gene (thick line), MBSs (solid boxes), putative cre (striped box), and relevant restriction sites are shown. (B) GusA assays for the Pmga-gusA constructs depicted in panel A inserted into the VIT locus of the wild-type JRS4-derived M6 GAS strain RTG229 (black bars), isogenic mga-inactivated strain KSM150Lg (open bars), and mga-inactivated KSM150Lg complemented with the Pspac-mga plasmid pKSM162 (shaded bars). Data are reported in GusA units (OD420/concentration of total protein [in micrograms per microliter]) and represent an average of the results from at least three independent experiments. The error bars express the standard deviations for each strain measured.
FIG. 4.
FIG. 4.
Real-time RT-PCR analysis of native Pmga P1 and mga transcripts. (A) Real-time RT-PCR was performed on total RNA isolated from JRS4-derived strains KSM440 (Full), KSM438 (Δcre), and KSM442 (ΔP1) as shown in the schematic. The ΩKm2 cassette (lollipops) and all relevant Pmga elements are shown. The location of the P1 (mga P1 RT) and the P1 plus P2 (mga RT) probes are indicated (dotted lines). (B) Levels of mga transcribed from the Pmga P1 start site only (black bars) were assessed using the P1 probe. (C) Total Pmga transcript levels (gray bars) were assessed using the P1 plus P2 probe. Transcript levels are shown as the fold transcript level above that of the full-length promoter (KSM440) that had been normalized to levels of the gyrA control. Reactions were performed in triplicate for three independent experiments. Error bars represent the minimum and maximum relative transcript levels based on the standard errors for the samples.
FIG. 5.
FIG. 5.
Deletion analysis of the Pmga P1 promoter region. (A) Schematic representation of gusA transcriptional reporters in the chromosomal VIT locus of the M6 GAS strains KSM310 (WT Pmga), KSM444 (full-length P1), KSM445 (P1 Δcre), and VIT-GusA (no promoter). The starts of transcription for mga (circles with arrows), the gusA gene (thick line), MBSs (solid boxes), and the putative cre (striped box) are shown. (B) Semiquantitative primer extension analysis was performed on total RNA from the full-length P1, P1 Δcre, and no-promoter reporter strains using the radiolabeled antisense primers Steph_gusA-PE for gusA and GAS-rpsL5 for rpsL (Table 2) in the same reaction. The starts of transcription for gusA (P1 Pmga) and rpsL (PrpsL) are shown at the left, and a Pmga P1 sequence ladder is provided at the right. Nonspecific background bands are indicated with an asterisk.
FIG. 6.
FIG. 6.
Effect of a CcpA mutant on mga expression. (A) GusA reporter assay for the M6 GAS Pmga-gusA reporter strain KSM310 (WT), the mga-inactivated derivative KSM310.150Lg (Mga), and the ccpA-inactivated derivative KSM310.700 (CcpA). Data are reported in GusA units (OD420/concentration total protein [in micrograms per microliter]) and represent an average of the results from at least three independent experiments. The error bars express the standard deviations for each strain measured. (B) Mga protein production was assessed using Western analysis on whole-cell protein extracts derived from the same samples used for panel A and probed with an anti-M6 Mga antibody.

Similar articles

Cited by

References

    1. Almengor, A. C., and K. S. McIver. 2004. Transcriptional activation of sclA by Mga requires a distal binding site in Streptococcus pyogenes. J. Bacteriol. 186:7847-7857. - PMC - PubMed
    1. Aung-Hilbrich, L. M., G. Seidel, A. Wagner, and W. Hillen. 2002. Quantification of the influence of HPrSer46P on CcpA-cre interaction. J. Mol. Biol. 319:77-85. - PubMed
    1. Caparon, M. G., R. T. Geist, J. Perez-Casal, and J. R. Scott. 1992. Environmental regulation of virulence in group A streptococci: transcription of the gene encoding M protein is stimulated by carbon dioxide. J. Bacteriol. 174:5693-5701. - PMC - PubMed
    1. Deutscher, J., C. Francke, and P. W. Postma. 2006. How phosphotransferase system-related protein phosphorylation regulates carbohydrate metabolism in bacteria. Microbiol. Mol. Biol. Rev. 70:939-1031. - PMC - PubMed
    1. Deutscher, J., E. Kuster, U. Bergstedt, V. Charrier, and W. Hillen. 1995. Protein kinase-dependent HPr/CcpA interaction links glycolytic activity to carbon catabolite repression in gram-positive bacteria. Mol. Microbiol. 15:1049-1053. - PubMed

Publication types

MeSH terms

LinkOut - more resources