

doi: 10.1038/nmeth1102.
Epub 2007 Sep 30.
A gene expression bar code for microarray data
Affiliations
- PMID: 17906632
- PMCID: PMC3154617
- DOI: 10.1038/nmeth1102
Item in Clipboard
A gene expression bar code for microarray data
Nat Methods.
2007 Nov.
Abstract
The ability to measure genome-wide expression holds great promise for characterizing cells and distinguishing diseased from normal tissues. Thus far, microarray technology has been useful only for measuring relative expression between two or more samples, which has handicapped its ability to classify tissue types. Here we present a method that can successfully predict tissue type based on data from a single hybridization. A preliminary web-tool is available online (http://rafalab.jhsph.edu/barcode/).
Figures
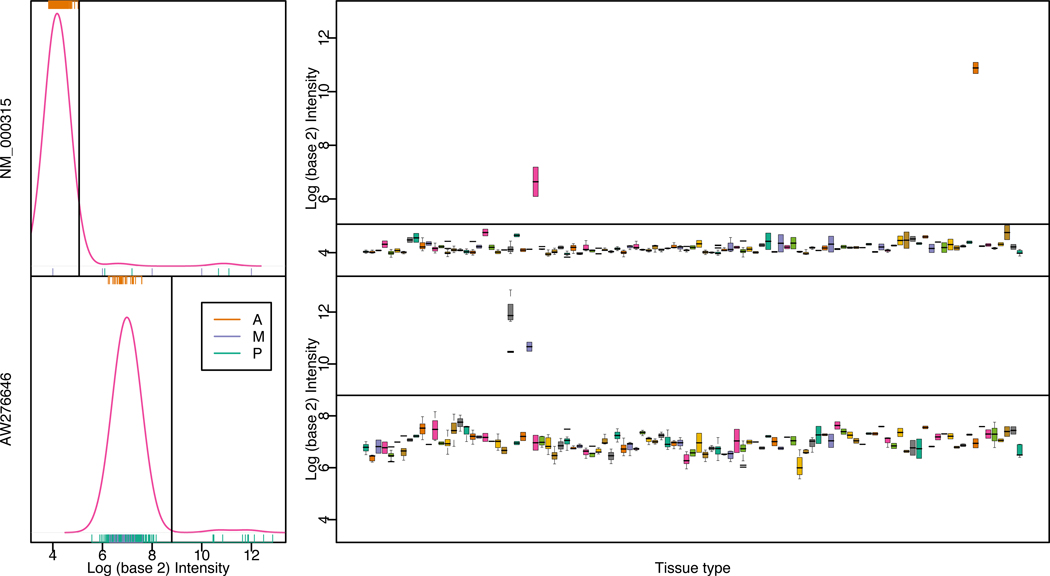
Across sample gene expression estimates distributions. Data for two human genes are shown with the Genbank accession number on the y-axis. The left pane shows across sample distribution for all tissues. The vertical line is automatically drawn by the barcode method and distinguishes the intensity range associated with expressed and unexpressed genes. The orange, purple and green ticks denote the observed values with color denoting the call provided by the manufacturer. Absent calls are shown on the top axis while present and marginal calls are shown on the bottom axis. Notice that for the gene shown above, the calls appear consistent with the plot. However, these calls appear unable to distinguish expressed from unexpressed for the gene shown in the bottom row. The boxplots stratify these calls by tissue. The horizontal line denotes the expressed/unexpressed boundary. Notice that all samples of the same tissue are consistently present or consistently absent.

Demonstration of the lab effect and its removal by the barcode algorithm. The correlation between every pair of samples from studies containing 10 or more arrays is shown in different shades of blue (negative correlation in red). For each gene the across-sample mean value was subtracted from the expression. The different studies are divided by black lines and labeled in the axes. In A) the blue high-correlation block on the bottom left demonstrates the lab effect. Most of the tissues in that study are completely different types and therefore the lab effect must be driving the high correlation. B) The same plot but using the barcode to define correlation. C) and D) The same plot zooming in to study E-AFMX-5. The lines now separate the different tissues.
References
-
- Irizarry RA, Gautier L, Cope LM. In: The Analysis of Gene Expression Data: Methods and Software. Parmigiani G, Garrett ES, Irizarry RA, Zeger SI, editors. New York: Springer-Verlag; 2003. pp. 102–119.
-
- Irizarry RA, et al. Multiple-laboratory comparison of microarray platforms. Nat. Methods. 2005;2:345–350. - PubMed
-
- Kim S, et al. Multivariate measurement of gene expression relationships. Genomics. 2000;67:201–209. - PubMed
-
- Pal R, Datta A, Fornace AJ, Jr, Bittner ML, Dougherty ER. Boolean relationships among genes responsive to ionizing radiation in the NCI 60 ACDS. Bioinformatics. 2005;21:1542–1549. - PubMed
MeSH terms
Grants and funding
LinkOut - more resources
Full Text Sources
Other Literature Sources
