Review
. 2007 Sep;3(9):1674-8.
doi: 10.1371/journal.pcbi.0030152.

From pathways databases to network models of switching behavior

Affiliations
Review

From pathways databases to network models of switching behavior

Baltazar D Aguda et al. PLoS Comput Biol. 2007 Sep.
No abstract available


Conflict of interest statement

Competing interests. The authors have declared that no competing interests exist.

Figures

Figure 1
Figure 1. The Regulatory Network of the G1-S Transition in the Mammalian Cell Cycle
Growth factors (GFs) trigger certain signaling cascades that lead to the activation of cyclin D/CDK4 complexes. Active CDK4 phosphorylates (thereby deactivating) the retinoblastoma protein (pRb) which inhibits entry into S phase due mainly to inhibitory binding with E2F transcription factors; these factors induce many of the genes required for S phase (such as members of the pre-replication complex, cyclin E, cyclin A, Cdc25A, etc.). Synthesis of cyclins E and A leads to activation of CDK2 which further phosphorylates (thereby deactivates) pRb. Another transcription factor, namely Myc, also contributes to the G1-S transition, but this protein's regulation is not shown. Arrows mean “activate,” and hammerheads mean “inhibit.” The dashed arrows signify the totality of gene expression steps (transcription and translation). Interactions numbered 1 to 10 form a minimal model that can account for the R point behavior.
Figure 2
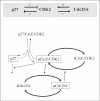
Figure 2. A Sharp Switch Is Expected from the Mutual-Activation and Mutual-Inhibition Topology Involving CDK2
Also shown are the known detailed mechanistic steps corresponding to the qNET shown in the upper panel (shaded grey). “a” refers to active, and “i” to inactive. Note that the network in the lower figure uses the chemist's convention of representing reaction steps; also, dashed arrows mean that the protein where the arrow originates from induces or catalyzes the reaction step that the arrow points to.
Figure 3
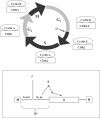
Figure 3. The Mammalian Cell Cycle Showing the G1, S, G2, and M Phases along with the Predominant Cyclin–CDK Activities Associated with Each Phase (Top Panel)
The lower panel shows the position of the R point (R) which subdivides the G1 phase into G1-pm (post-mitosis) and G1-ps (pre-S-phase). Quiescent or non-dividing cells have to be exposed to continuous growth-factor stimulation up until the R point in order to commit to entry into S-phase. After R and a finite induction period, cyclin E/CDK2 activity increases (shown by the dashed curve labelled E) as reported by Ekholm et al. [6].

Similar articles

Cited by

References

    1. Bader GD, Cary MP, Sander C. Pathguide: A pathway resource list. Nucleic Acids Research. 2006;34:D504–D506. - PMC - PubMed
    1. Aguda BD, Craciun G, Cetin-Atalay R. Data sources and computational approaches for generating models of gene regulatory networks. Rev Comput Chem. 2005;21:381–411.
    1. Qi Y, Ge H. Modularity and dynamics of cellular networks. PLoS Comput Biol. 2006;2:e174. doi: 10.1371/journal.pcbi.0020174. - DOI - PMC - PubMed
    1. Ma'ayan A, Blitzer RD, Iyengar R. Toward predictive models of mammalian cells. Annu Rev Biophys Biomol Struct. 2005;34:319–349. - PMC - PubMed
    1. Aldridge BB, Burke JM, Lauffenburger DA, Sorger PK. Physicochemical modelling of cell signalling pathways. Nat Cell Biol. 2006;8:1195–1203. - PubMed

MeSH terms