. 2007 Sep 7;3(9):1348-60.
doi: 10.1371/journal.ppat.0030140.

Viral oncogene-induced DNA damage response is activated in Kaposi sarcoma tumorigenesis

Affiliations

Viral oncogene-induced DNA damage response is activated in Kaposi sarcoma tumorigenesis

Sonja Koopal et al. PLoS Pathog. .

Abstract

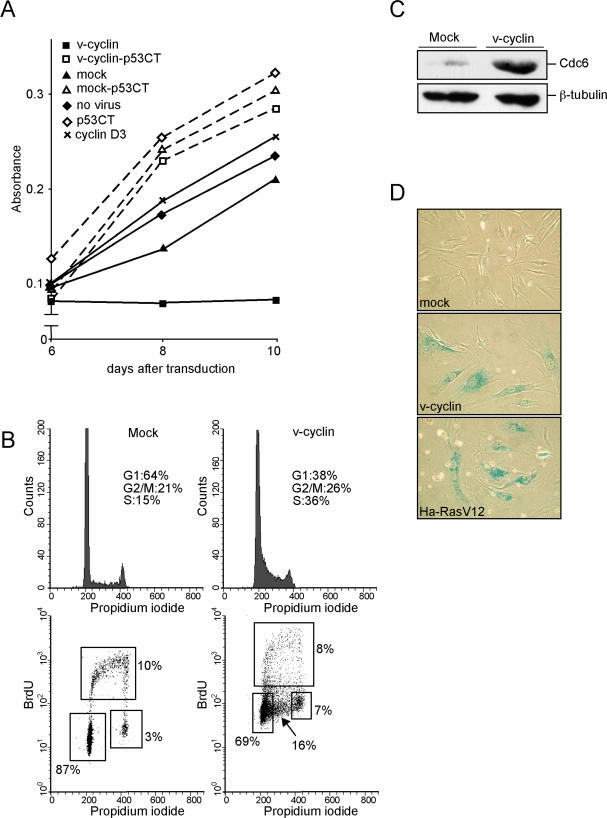
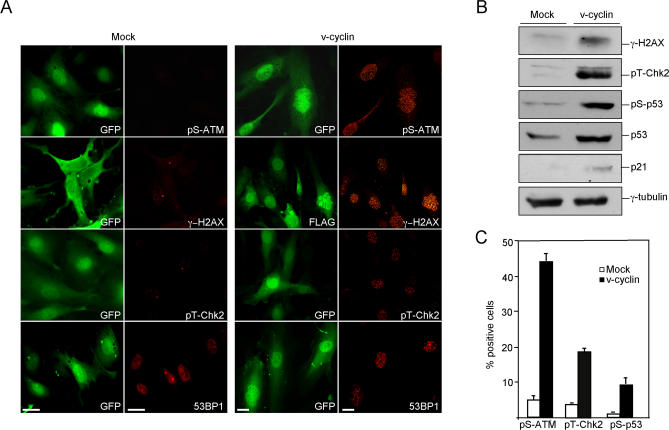
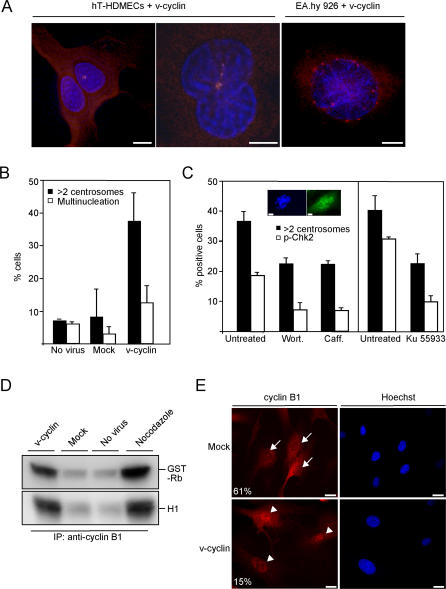
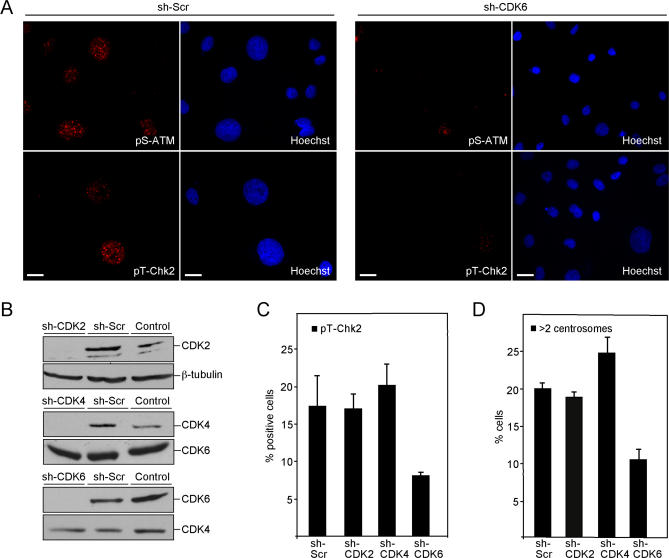
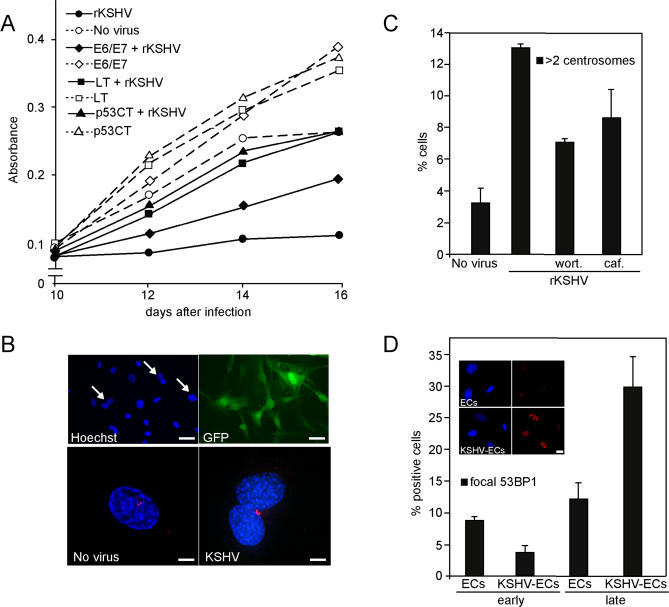
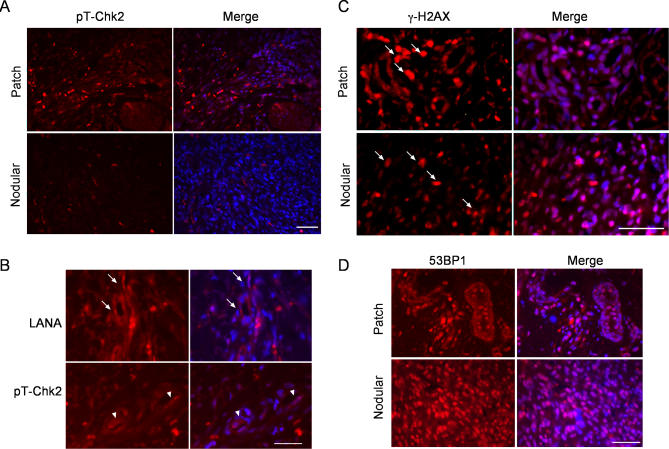
Kaposi sarcoma is a tumor consisting of Kaposi sarcoma herpesvirus (KSHV)-infected tumor cells that express endothelial cell (EC) markers and viral genes like v-cyclin, vFLIP, and LANA. Despite a strong link between KSHV infection and certain neoplasms, de novo virus infection of human primary cells does not readily lead to cellular transformation. We have studied the consequences of expression of v-cyclin in primary and immortalized human dermal microvascular ECs. We show that v-cyclin, which is a homolog of cellular D-type cyclins, induces replicative stress in ECs, which leads to senescence and activation of the DNA damage response. We find that antiproliferative checkpoints are activated upon KSHV infection of ECs, and in early-stage but not late-stage lesions of clinical Kaposi sarcoma specimens. These are some of the first results suggesting that DNA damage checkpoint response also functions as an anticancer barrier in virally induced cancers.


Conflict of interest statement

Competing interests. The authors have declared that no competing interests exist.

Figures

Figure 1
Figure 1. v-Cyclin Expression in ECs Triggers an Intra–S-Phase Growth Arrest
(A) hT-HDMECs expressing mock, v-cyclin, or cyclin D3, and hT-HDMECs-p53CTer expressing mock (mock-p53CT) or v-cyclin (v-cyclin-p53CT) were assayed for metabolic activity by a MTT assay at 6, 8, and 10 d after transduction. Nontransduced hT-HDMECs (no virus) were included as a control in the assay. (B) hT-HDMECs expressing mock or v-cyclin were subjected to cell-cycle analysis by BrdU incorporation and flow cytometry. The percentages of cells at specific cell-cycle phases are indicated. The numbers represent mean values of four independent experiments. (C) Whole-cell extracts of hT-HDMECs expressing mock or v-cyclin were resolved by SDS-PAGE (12%) and immunoblotted with antibodies against Cdc6. Anti–β-tubulin was used as a loading control. (D) hT-HDMECs constitutively expressing mock, v-cyclin, or H-RasV12 were grown for 7 d. Cells were fixed and stained for senescence-associated beta-galactosidase activity.
Figure 2
Figure 2. DNA Damage Response in v-Cyclin–ECs
(A) hT-HDMECs expressing mock (pBMNIresEGFP) or v-cyclin (KpBMNIresEGFP) retroviruses were analysed at day 5 after transduction for expression of GFP and the indicated DNA damage markers. The labeling with anti-gamma-H2AX antibody requires EtOH fixation, which leads to a partial loss of soluble GFP and thus reduced signal. Therefore, to allow simultaneous detection of γ-H2AX together with mock or v-cyclin, the cells in these panels were labeled also with α-GFP or α-Flag (for v-cyclin) antibodies, respectively. Scale bar = 20 μm. (B) hTERT-HDMECs expressing mock or v-cyclin at day 7 were immunoblotted with antibodies indicated on the left. γ-tubulin was used as a loading control. (C) hT-HDMECs expressing mock or v-cyclin were analysed at day 5 by indirect immunofluorescence to determine the percentage of cells positive for the indicated DNA damage markers. The average of two individual experiments is shown. Approximately 200 cells were analysed per sample.
Figure 3
Figure 3. Centrosome Amplification and Multinucleation in the v-Cyclin–ECs
(A) hT-HDMECs (left and middle panels) or EA.hy 926 cells (right panel) expressing v-cyclin were analysed for centrosomes at day 3 or 5, respectively, by anti–γ-tubulin antibody (red) and DNA by Hoechst staining (blue). Scale bar = 10 μm. (B) Quantitation of the number of centrosomes and multinuclear cells in the nontransduced (No virus), mock, or v-cyclin–expressing hT-HDMECs at day 3 after transduction. The average of two independent experiments and analysis of about 200 cells per sample is shown. (C) Inhibition of the ATM-Chk2–dependent checkpoint decreases centrosome aberrations in v-cyclin–ECs. v-cyclin–ECs were treated with wortmannin (200 nM) or caffeine (2 mM) 3 d after transduction for 4 h (left graph), or with KU-55933 (2 μM) 6 d after transduction for 3 d (right graph). Treated and untreated cells were analyzed to determine the percentage of cells with activated Chk2 (by anti–pT-Chk2) or with more than two centrosomes (by anti–γ-tubulin). The average of two independent experiments is shown. More than 200 cells were analyzed per sample. Insert: inhibition of the ATM-Chk2–dependent checkpoint in v-cyclin–ECs leads to formation of multinucleated syncytia-like cells. Scale bar = 10 μm. (D) Cell extracts of nontransduced hT-HDMECs (No virus), or hT-HDMECs expressing mock or v-cyclin for 2 d were immunoprecipitated with anti–cyclin B1 antibodies, and subjected to in vitro kinase assay using GST-Rb and histone H1 as substrates. hTERT-HDMECs treated with nocodazole (75 ng/ml) were used as a positive control. Kinase activity was determined by autoradiography after SDS-PAGE (12%). (E) hT-HDMECs expressing mock or v-cyclin were labeled with α-cyclin B1 (red) and Hoechst (blue) at day 6 after transduction. Slides were microscopically analyzed to determine the percentage of cells where cyclin B1 was excluded from the nucleus (% on the left). About 200 cells were counted per sample. Arrows indicate cells with cyclin B1 signal excluded from the nucleus, and arrowheads indicate the cells with nuclear cyclin B1 signal. Scale bar = 20 μm.
Figure 4
Figure 4. v-Cyclin–Induced DNA Damage Response and Centrosome Amplification Are CDK6-Dependent
(A) shRNA-encoding EA.hy926 cells sh-Scramble or sh-CDK6 were transduced with v-cyclin retrovirus, and grown for 5 d. Transduced cells were labeled with antibodies against pS-ATM, pT-Chk2, and Hoechst (blue) for DNA. Scale bar = 20 μm. (B) Depletion of CDK2, CDK4, or CDK6 expression in EA.hy926 cells. The cells were stably transduced with the shRNA-encoding lentiviruses targeting either CDK2, CDK4, CDK6, or a random noncoding sequence (sh-Scr). Whole-cell extracts were resolved by SDS-PAGE (12%) and immunoblotted with antibodies against CDK2, CDK4, CDK6, and β-tubulin. (C) shRNA-encoding EA.hy926 cells sh-CDK2, sh-CDK4, sh-CDK6, or sh-Scr were transduced with v-cyclin retrovirus as in (A), and labeled with antibody to pT-Chk2 to determine the percentage of cells with active Chk2. The average of two independent experiments with at least 200 cells analysed per sample is shown. (D) The sh-CDK2, sh-CDK4, sh-CDK6, or sh-Scr cells were transduced with v-cyclin retrovirus as in (A), and labeled with anti–γ-tubulin antibodies and Hoechst to analyse the centrosome numbers. The average of two independent experiments with at least 200 cells analysed per sample is shown.
Figure 5
Figure 5. Antiproliferative Checkpoints Are Activated in KSHV-Infected ECs
(A) hT-HDMECs, hT-HDMEC–p53CTer, hT-HDMEC–LT, and hT-HDMEC–E6/E7 were infected with rKSHV.219 virus and grown for 9 d. Proliferation of these cells in relation to noninfected cells was determined by the MTT assay at 10, 12, 14, and 16 d after infection. (B) Top panels: KSHV-ECs grown for 7 d and stained with Hoechst. GFP is expressed from the recombinant virus. Arrows indicate binucleated cells. Scale bar = 50 μm. Lower panels: Noninfected (No virus) and KSHV-ECs were analysed for centrosomes by anti–γ-tubulin antibodies (red) and DNA by Hoechst staining (blue) at day 7. Scale bar = 5 μm. (C) KSHV-ECs were treated with wortmannin (200 nM) or caffeine (4 mM) for 24 h, and analysed for the centrosome numbers by γ-tubulin antibodies. Untreated as well and noninfected (No virus) ECs were used as controls. Percentage of cells with aberrant centrosome numbers is shown as an average of two independent experiments and analysis of at least 200 cells per sample. (D) KSHV-ECs grown for 2 wk (early) or approximately 10 wk (late), and their passage-matched, noninfected ECs were labeled with anti-53BP1 antibodies to address activation of the DNA damage response. The bar graph shows the percentage of cells with intranuclear 53BP1-positive foci. About 200 cells were counted per sample. The insert depicts noninfected (ECs) and late KSHV-ECs showing intranuclear 53BP1 foci in the latter one (bottom right panel). Scale bar = 20 μm.
Figure 6
Figure 6. DNA Damage Response Is Activated in Early-Stage KS Lesions
(A) Paraffin-embedded sections of early-stage (Patch) and late-stage (Nodular) KS skin tumors were stained for pT-Chk2, and nuclei were counterstained with Hoechst 33342. Images were captured at 40× magnification. (B) An early, patch-stage KS lesion stained for LANA and pT-Chk2, and counterstained with Hoechst 33342. Images were captured at 63× magnification, and represent consecutive sections. Arrows indicate nuclear, punctate LANA staining, and arrowheads indicate the pT-Chk2–positive nuclei also displaying a nuclear, punctate signal. (C) Early-stage (Patch) and late-stage (Nodular) KS skin lesions were stained for γ-H2AX, and nuclei were counterstained with Hoechst 33342. Arrows indicate infiltrated red blood cells. Images were captured at 40× magnification. (D) Early-stage (Patch) and late-stage (Nodular) KS lesions were stained for 53BP1, and nuclei were counterstained with Hoechst 33342. Images were captured at 63× magnification. Scale bars in all panels = 50 μM.

Similar articles

Cited by

References

    1. Bartkova J, Rezaei N, Liontos M, Karakaidos P, Kletsas D, et al. Oncogene-induced senescence is part of the tumorigenesis barrier imposed by DNA damage checkpoints. Nature. 2006;444:633–637. - PubMed
    1. Gorgoulis VG, Vassiliou LV, Karakaidos P, Zacharatos P, Kotsinas A, et al. Activation of the DNA damage checkpoint and genomic instability in human precancerous lesions. Nature. 2005;434:907–913. - PubMed
    1. Vafa O, Wade M, Kern S, Beeche M, Pandita TK, et al. c-Myc can induce DNA damage, increase reactive oxygen species, and mitigate p53 function: A mechanism for oncogene-induced genetic instability. Mol Cell. 2002;9:1031–1044. - PubMed
    1. Lindstrom MS, Wiman KG. Myc and E2F1 induce p53 through p14ARF-independent mechanisms in human fibroblasts. Oncogene. 2003;22:4993–5005. - PubMed
    1. Di Micco R, Fumagalli M, Cicalese A, Piccinin S, Gasparini P, et al. Oncogene-induced senescence is a DNA damage response triggered by DNA hyper-replication. Nature. 2006;444:638–642. - PubMed

Publication types