. 2007 Sep;3(9):1770-84.
doi: 10.1371/journal.pgen.0030164.

Gene expression programs of human smooth muscle cells: tissue-specific differentiation and prognostic significance in breast cancers

Affiliations

Gene expression programs of human smooth muscle cells: tissue-specific differentiation and prognostic significance in breast cancers

Jen-Tsan Chi et al. PLoS Genet. 2007 Sep.

Abstract

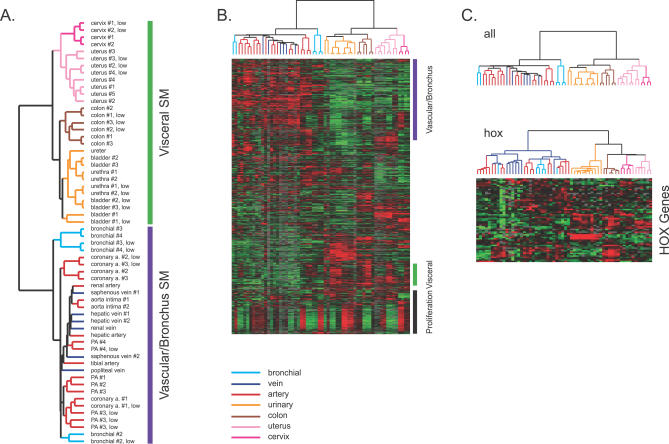
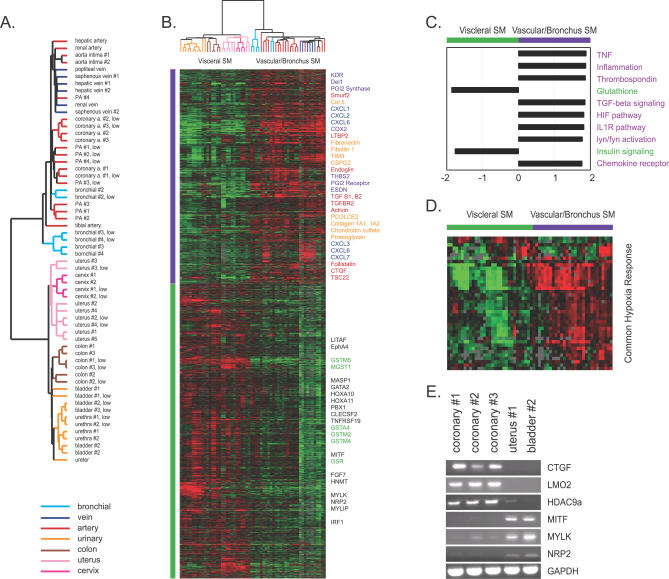
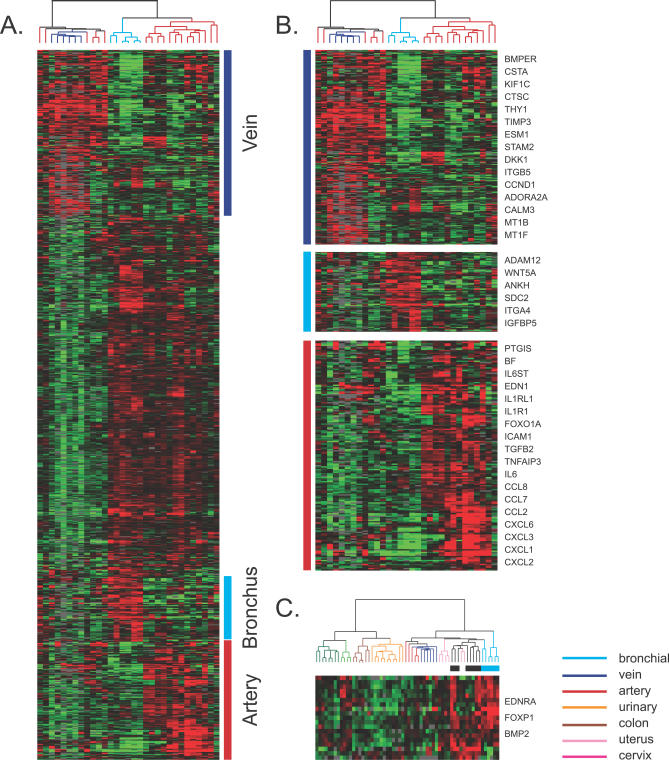
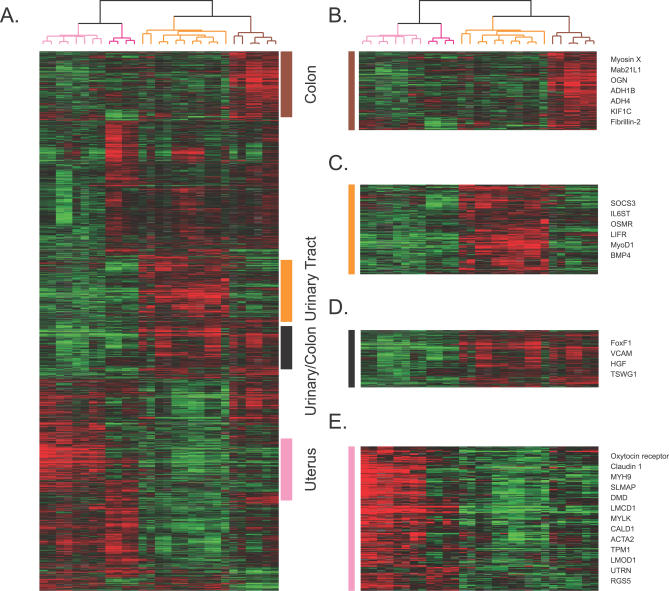
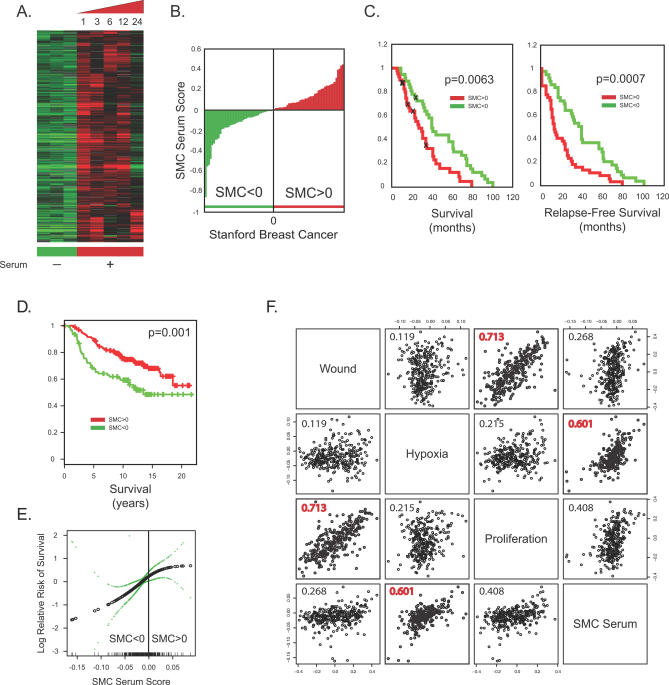
Smooth muscle is present in a wide variety of anatomical locations, such as blood vessels, various visceral organs, and hair follicles. Contraction of smooth muscle is central to functions as diverse as peristalsis, urination, respiration, and the maintenance of vascular tone. Despite the varied physiological roles of smooth muscle cells (SMCs), we possess only a limited knowledge of the heterogeneity underlying their functional and anatomic specializations. As a step toward understanding the intrinsic differences between SMCs from different anatomical locations, we used DNA microarrays to profile global gene expression patterns in 36 SMC samples from various tissues after propagation under defined conditions in cell culture. Significant variations were found between the cells isolated from blood vessels, bronchi, and visceral organs. Furthermore, pervasive differences were noted within the visceral organ subgroups that appear to reflect the distinct molecular pathways essential for organogenesis as well as those involved in organ-specific contractile and physiological properties. Finally, we sought to understand how this diversity may contribute to SMC-involving pathology. We found that a gene expression signature of the responses of vascular SMCs to serum exposure is associated with a significantly poorer prognosis in human cancers, potentially linking vascular injury response to tumor progression.


Conflict of interest statement

Competing interests. POB is a cofounder of the Public Library of Science and is on its board of directors.

Figures

Figure 1
Figure 1. Diversity of SMC Gene Expression Patterns
(A) Gene expression patterns of cultured SMCs organized by unsupervised hierarchical clustering. The global gene expression patterns of 60 cultured SMCs were sorted based on similarity by hierarchical clustering. Approximately 6,166 gene elements (representing 5,236 distinct genes) were selected from the total dataset, based on variations in expression relative to the mean expression level across all samples greater than 3-fold in at least two cell samples. The anatomic origins of each SMC culture are indicated and color coded. The apparent order in the grouping of SMC gene expression patterns is indicated in this dendrogram. (B) Overview of gene expression patterns of all SMC samples. The variations in gene expression described in Figure1A are shown in matrix format. The scale extends from 0.25- to 4-fold variation from the mean across all samples (−2 to +2 in log2 scale). Gray represents missing data. The gene clusters characteristic of vascular/bronchial, visceral SMCs, and proliferation are indicated on the right. Complete data can be found on the supplementary Web site and SMD. (C) Gene expression patterns of cultured SMCs organized by unsupervised hierarchical clustering based on expression of 63 homeodomain genes. The dendrogram generated by 63 hox genes (labeled as “hox”) is compared with the dendrogram generated by all genes (labeled as “all”).
Figure 2
Figure 2. Vascular and Visceral SMC Gene Expression Programs
(A) Identification of vascular and visceral SMC gene expression programs. Dendrogram representing the result of hierarchical clustering of SMCs, based on the similarities in their pattern of expression of the genes selected by a two class SAM test. (B) Features of vascular and visceral SMC gene expression programs. The expression of 2,338 vascular SMC-specific genes and 2,462 visceral SMC-specific genes selected by SAM analysis is shown here. Genes involved in TGF-β signaling (red), ECM components and biosynthesis (orange), inflammatory response (blue), and endothelial cell interaction (purple) are labeled by the indicated colors. Complete data can be found on the supplementary Web site and SMD. (C) Comparison of pathway activity in vascular and visceral SMCs by Gene Set Enrichment Analysis. The top ten molecular pathways ranked by normalized enrichment scores enriched specifically in vascular (purple, positive) or visceral (green, negative) SMC samples are shown. (D) The expression of a common hypoxia gene signature among all SMCs. The expression values of 71 genes constituting the common hypoxia response in the vascular versus visceral SMCs are shown. (E) Confirmation of specific expression of CTGF, LMO2, and HDAC9 in vascular SMCs; of specific expression of MITF, MYLK, and NRP2 in visceral SMCs; and of control gene GAPDH in all SMCs with RT-PCR.
Figure 3
Figure 3. Artery, Vein, and Bronchial SMC-Specific Gene Expression Program
(A, B) Artery-, vein-, and bronchus-specific genes were identified by a multi-class SAM analysis. The names of select vein-specific genes (blue bar), bronchus-specific genes (light blue bar), and artery-specific genes (red bar) are shown and expanded in (B). Complete data can be found on the supplementary Web site and SMD. (C) Features of a gene cluster with expression in lung tissues. Pulmonary artery clusters are marked by the black horizontal bar and bronchus clusters are marked by the light blue horizontal bar. Selected genes are shown.
Figure 4
Figure 4. Colon-, Urinary Tract-, and Uterus-Specific Gene Expression programs
(A–D) Colon-, urinary tract-, cervix- and uterus-specific gene expression identified by a multi-class SAM analysis are shown in (A) and names of select genes are expanded in (B–E). Named genes are colon specific (B, brown bar), urinary tract specific (C, orange bar), urinary/colon specific (D, black bar) and uterus specific (E, pink bar). Complete data can be found on the supplementary Web site and SMD.
Figure 5
Figure 5. Analysis of Vascular SMC Serum Response and Its Prognostic Significance in Human Cancers
(A, B) Expression of the 653 genes in the SMC serum-response signature in coronary SMCs before (green) and after (red) serum exposure at indicated time points (A). The SMC serum-response scores of the Stanford breast tumor collection (B) were calculated based on the average expression values of the serum-response signature genes. The tumors were separated based on whether SMC serum-response scores were positive (red, right) or negative (green, left). (C, D) With the threshold value of the SMC serum-response signature set at zero for classification of patients into high (red) and low (green) SMC serum-response groups, the Kaplan-Meier analysis shows significant differences in survival and time to recurrence between the two groups of samples in the Stanford (C) and NKI (D) breast cancer datasets. (E) Correlation of the quantitative and continuous SMC serum-response score (x-axis) of each tumor sample (black circle) in the NKI breast cancer dataset versus the (log) relative risk (y-axis) of mortality. (F) Scatter plots showing the relationship between the wound-response [66], hypoxia-response [36], proliferation [67], and SMC serum-response signatures. Each point in the scatter plots represents a single one of the 295 tumors analyzed in the NKI dataset. The overall correlation between each pair of expression signatures across this set of 295 samples is indicated in each panel.

Similar articles

Cited by

References

    1. Owens GK, Wise G. Regulation of differentiation/maturation in vascular smooth muscle cells by hormones and growth factors. Agents Actions Suppl. 1997;48:3–24. - PubMed
    1. Kumar MS, Owens GK. Combinatorial control of smooth muscle-specific gene expression. Arterioscler Thromb Vasc Biol. 2003;23:737–747. - PubMed
    1. Owens GK, Kumar MS, Wamhoff BR. Molecular regulation of vascular smooth muscle cell differentiation in development and disease. Physiol Rev. 2004;84:767–801. - PubMed
    1. Wang D, Chang PS, Wang Z, Sutherland L, Richardson JA, et al. Activation of cardiac gene expression by myocardin, a transcriptional cofactor for serum response factor. Cell. 2001;105:851–862. - PubMed
    1. Belaguli NS, Sepulveda JL, Nigam V, Charron F, Nemer M, et al. Cardiac tissue enriched factors serum response factor and GATA-4 are mutual coregulators. Mol Cell Biol. 2000;20:7550–7558. - PMC - PubMed

Publication types

MeSH terms