

Human immunodeficiency virus type 1 Nef protein modulates the lipid composition of virions and host cell membrane microdomains
- PMID: 17908312
- PMCID: PMC2065869
- DOI: 10.1186/1742-4690-4-70
Human immunodeficiency virus type 1 Nef protein modulates the lipid composition of virions and host cell membrane microdomains
Abstract
Background: The Nef protein of Human Immunodeficiency Viruses optimizes viral spread in the infected host by manipulating cellular transport and signal transduction machineries. Nef also boosts the infectivity of HIV particles by an unknown mechanism. Recent studies suggested a correlation between the association of Nef with lipid raft microdomains and its positive effects on virion infectivity. Furthermore, the lipidome analysis of HIV-1 particles revealed a marked enrichment of classical raft lipids and thus identified HIV-1 virions as an example for naturally occurring membrane microdomains. Since Nef modulates the protein composition and function of membrane microdomains we tested here if Nef also has the propensity to alter microdomain lipid composition.
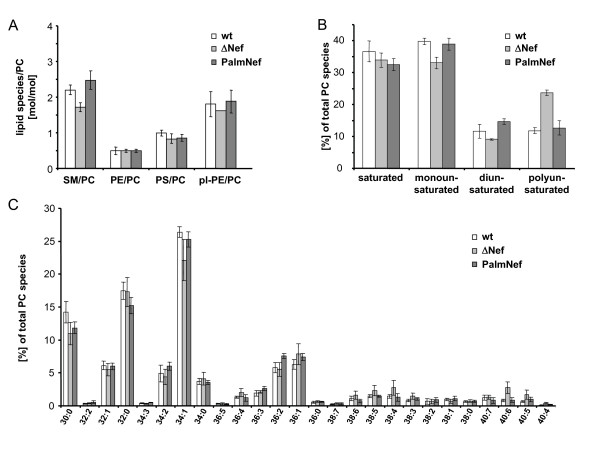
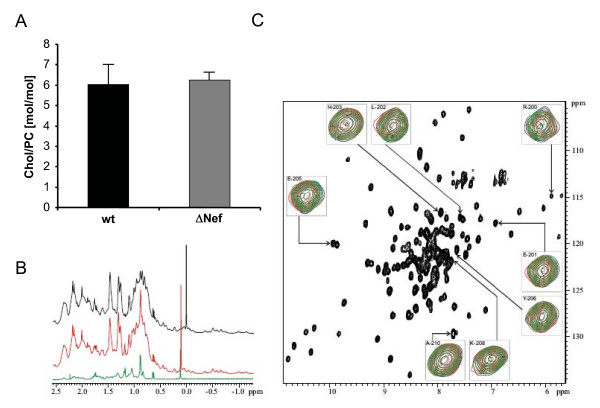
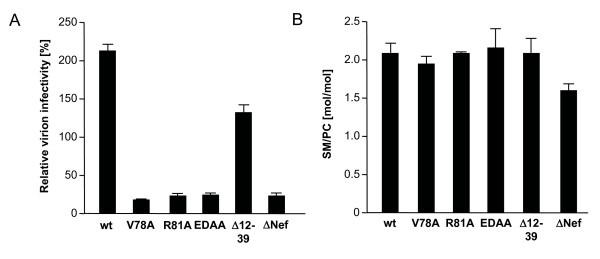
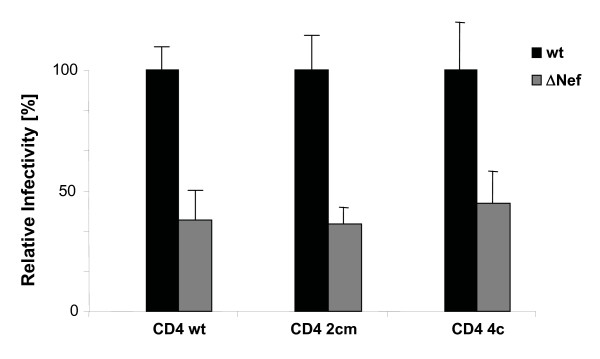
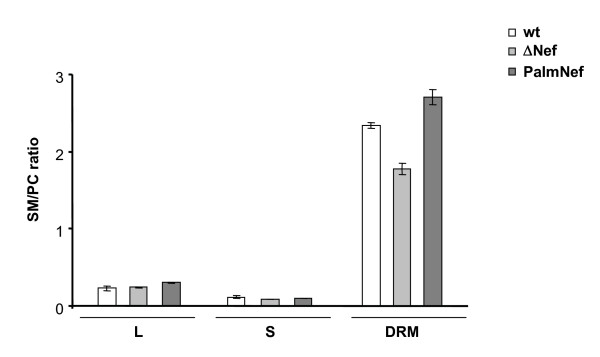
Results: Quantitative mass spectrometric lipidome analysis of highly purified HIV-1 particles revealed that the presence of Nef during virus production from T lymphocytes enforced their raft character via a significant reduction of polyunsaturated phosphatidylcholine species and a specific enrichment of sphingomyelin. In contrast, Nef did not significantly affect virion levels of phosphoglycerolipids or cholesterol. The observed alterations in virion lipid composition were insufficient to mediate Nef's effect on particle infectivity and Nef augmented virion infectivity independently of whether virus entry was targeted to or excluded from membrane microdomains. However, altered lipid compositions similar to those observed in virions were also detected in detergent-resistant membrane preparations of virus producing cells.
Conclusion: Nef alters not only the proteome but also the lipid composition of host cell microdomains. This novel activity represents a previously unrecognized mechanism by which Nef could manipulate HIV-1 target cells to facilitate virus propagation in vivo.
Figures
Similar articles
-
Specific and distinct determinants mediate membrane binding and lipid raft incorporation of HIV-1(SF2) Nef.Virology. 2006 Nov 25;355(2):175-91. doi: 10.1016/j.virol.2006.07.003. Epub 2006 Aug 17. Virology. 2006. PMID: 16916529
-
The host-cell restriction factor SERINC5 restricts HIV-1 infectivity without altering the lipid composition and organization of viral particles.J Biol Chem. 2017 Aug 18;292(33):13702-13713. doi: 10.1074/jbc.M117.797332. Epub 2017 Jun 28. J Biol Chem. 2017. PMID: 28659343 Free PMC article.
-
Human immunodeficiency virus type 1 Nef activates p21-activated kinase via recruitment into lipid rafts.J Virol. 2004 Apr;78(8):4085-97. doi: 10.1128/jvi.78.8.4085-4097.2004. J Virol. 2004. PMID: 15047825 Free PMC article.
-
Role of the CD4 down-modulation activity of Nef in HIV-1 infectivity.Curr HIV Res. 2011 Oct;9(7):490-5. doi: 10.2174/157016211798842125. Curr HIV Res. 2011. PMID: 22103832 Review.
-
Cell-dependent functional roles of HIV-1 Nef for virus replication (review).Int J Mol Med. 1999 Apr;3(4):427-30. doi: 10.3892/ijmm.3.4.427. Int J Mol Med. 1999. PMID: 10085418 Review.
Cited by
-
HIV-1 Nef promotes the localization of Gag to the cell membrane and facilitates viral cell-to-cell transfer.Retrovirology. 2013 Jul 30;10:80. doi: 10.1186/1742-4690-10-80. Retrovirology. 2013. PMID: 23899341 Free PMC article.
-
HIV-1 pathogenicity and virion production are dependent on the metabolic phenotype of activated CD4+ T cells.Retrovirology. 2014 Nov 25;11:98. doi: 10.1186/s12977-014-0098-4. Retrovirology. 2014. PMID: 25421745 Free PMC article.
-
HIV entry in macrophages is dependent on intact lipid rafts.Virology. 2009 Mar 30;386(1):192-202. doi: 10.1016/j.virol.2008.12.031. Epub 2009 Jan 30. Virology. 2009. PMID: 19185899 Free PMC article.
-
Nef decreases HIV-1 sensitivity to neutralizing antibodies that target the membrane-proximal external region of TMgp41.PLoS Pathog. 2011 Dec;7(12):e1002442. doi: 10.1371/journal.ppat.1002442. Epub 2011 Dec 15. PLoS Pathog. 2011. PMID: 22194689 Free PMC article.
-
The activity of Nef on HIV-1 infectivity.Front Microbiol. 2014 May 20;5:232. doi: 10.3389/fmicb.2014.00232. eCollection 2014. Front Microbiol. 2014. PMID: 24904546 Free PMC article. Review.
References
-
- Deacon NJ, Tsykin A, Solomon A, Smith K, Ludford-Menting M, Hooker DJ, McPhee DA, Greenway AL, Ellett A, Chatfield C, et al. Genomic structure of an attenuated quasi species of HIV-1 from a blood transfusion donor and recipients. Science. 1995;270:988–991. doi: 10.1126/science.270.5238.988. - DOI - PubMed
Publication types
MeSH terms
Substances
LinkOut - more resources
Full Text Sources
Other Literature Sources
