. 2007 Oct 1:7:63.
doi: 10.1186/1472-6807-7-63.

Metal ion-dependent, reversible, protein filament formation by designed beta-roll polypeptides

Affiliations

Metal ion-dependent, reversible, protein filament formation by designed beta-roll polypeptides

Andrew J Scotter et al. BMC Struct Biol. .

Abstract

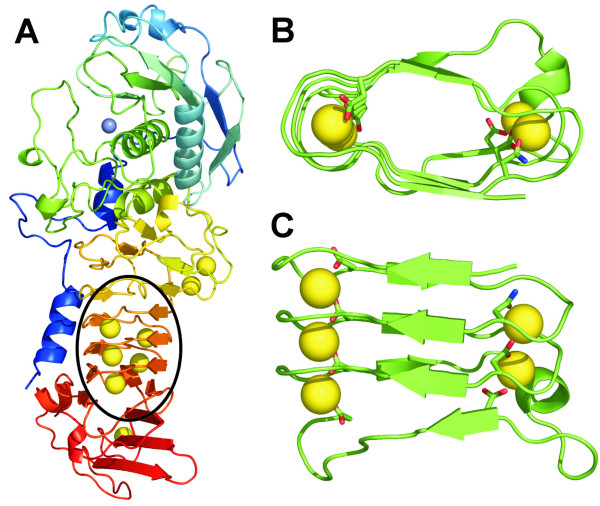
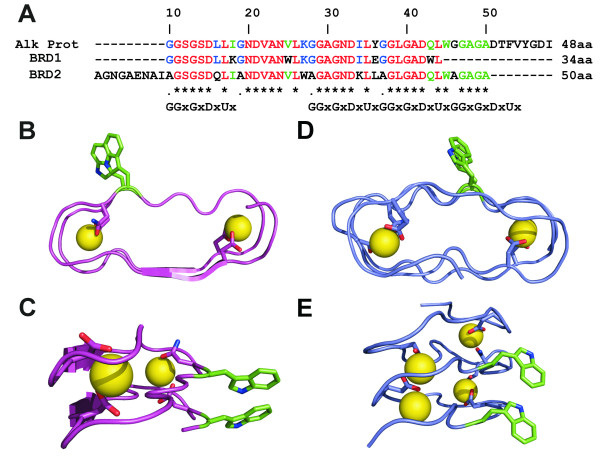
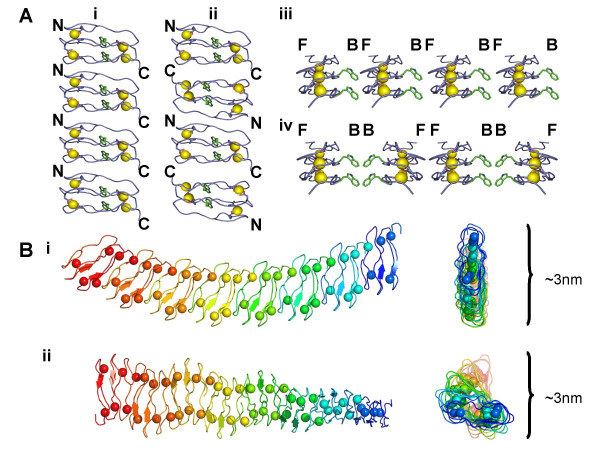
Background: A right-handed, calcium-dependent beta-roll structure found in secreted proteases and repeat-in-toxin proteins was used as a template for the design of minimal, soluble, monomeric polypeptides that would fold in the presence of Ca2+. Two polypeptides were synthesised to contain two and four metal-binding sites, respectively, and exploit stacked tryptophan pairs to stabilise the fold and report on the conformational state of the polypeptide.

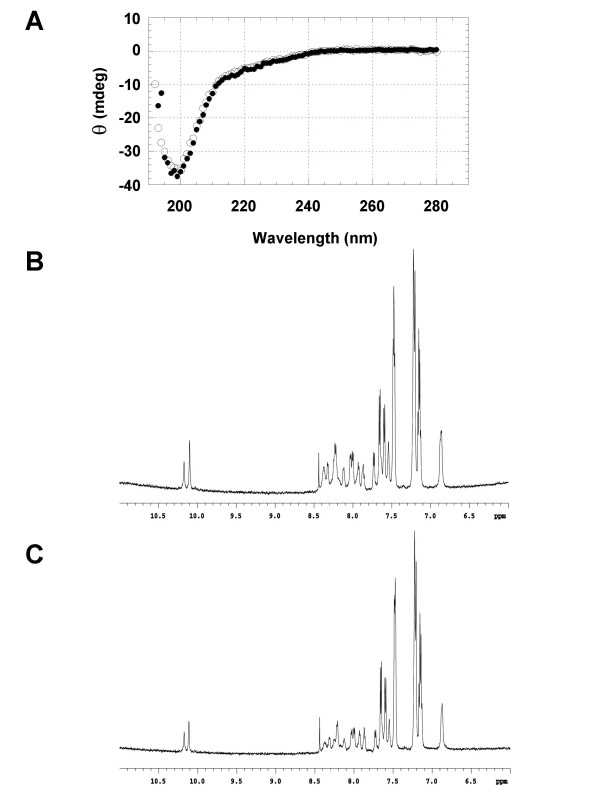
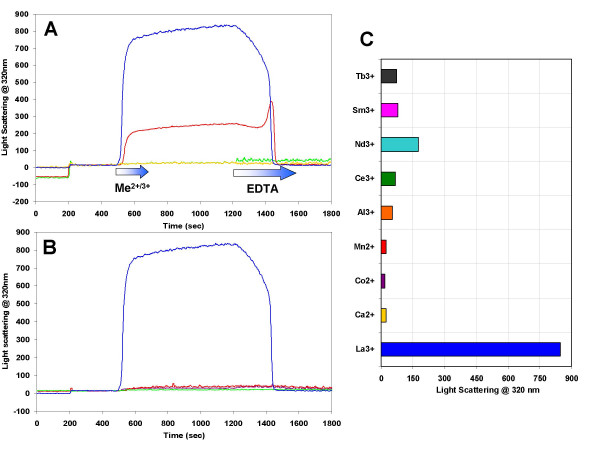
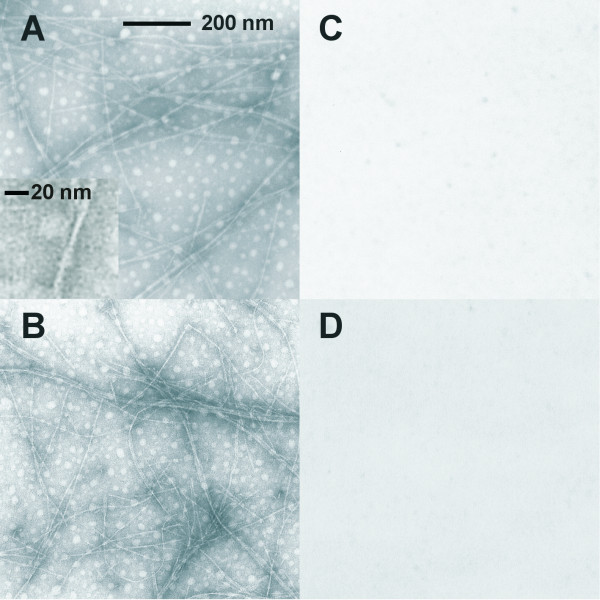
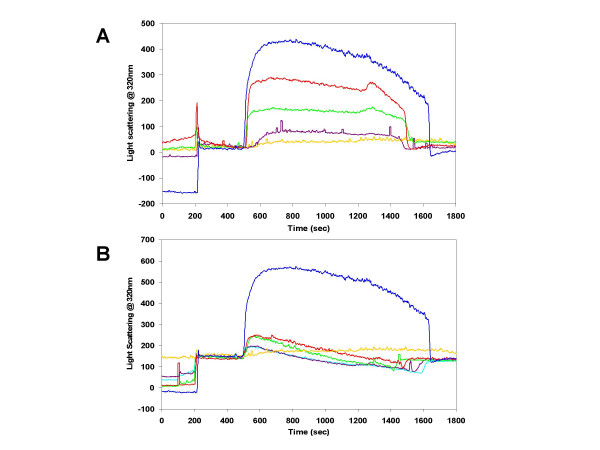
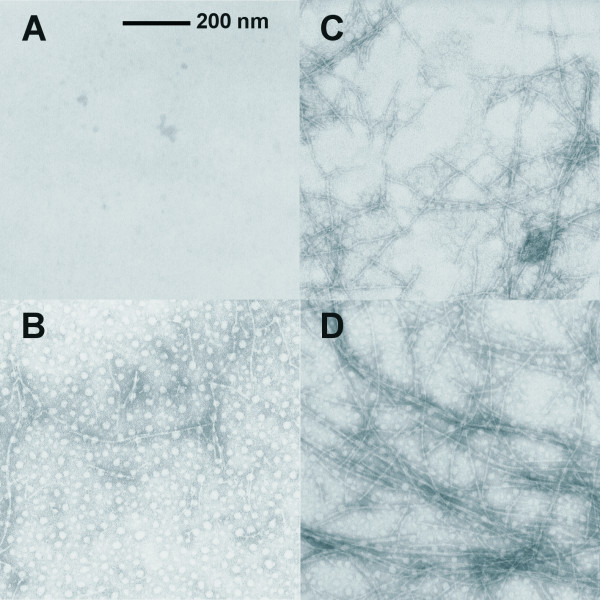
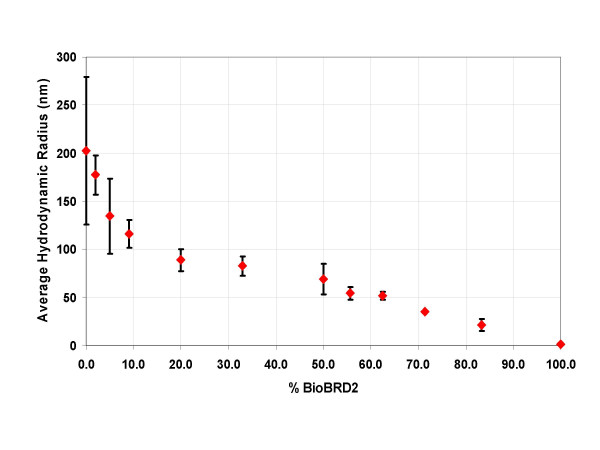
Results: Initial analysis of the two polypeptides in the presence of calcium suggested the polypeptides were disordered. The addition of lanthanum to these peptides caused aggregation. Upon further study by right angle light scattering and electron microscopy, the aggregates were identified as ordered protein filaments that required lanthanum to polymerize. These filaments could be disassembled by the addition of a chelating agent. A simple head-to-tail model is proposed for filament formation that explains the metal ion-dependency. The model is supported by the capping of one of the polypeptides with biotin, which disrupts filament formation and provides the ability to control the average length of the filaments.

Conclusion: Metal ion-dependent, reversible protein filament formation is demonstrated for two designed polypeptides. The polypeptides form filaments that are approximately 3 nm in diameter and several hundred nm in length. They are not amyloid-like in nature as demonstrated by their behaviour in the presence of congo red and thioflavin T. A capping strategy allows for the control of filament length and for potential applications including the "decoration" of a protein filament with various functional moieties.


Figures

Figure 1
Figure 1
The crystal structure of alkaline protease from Pseudomonas aeruginosa (1KAP) to 1.64 Å and the β-roll domain in isolation. A) Full structure of the zinc metalloprotease [7] showing the zinc atom coordinated in the active site (blue sphere) and the calcium binding β-roll circled in black; B) Enlarged view looking down the axis of the β-roll of alkaline protease including the five bound calcium ions (orange spheres), the parallel β-strands and tight turns around the metal-binding sites and the side chains of the seven residues making contact with Ca2+ ions: Asp338, Asn347, Asp356, Asp365, Asp374, Asp 390 and Asp400; C) Enlarged view of the front face of the β-roll of alkaline protease with the same residues highlighted as in panel B.
Figure 2
Figure 2
The amino acid sequence and modeled structures of BRD1 and BRD2. A) Amino acid sequence alignment of the β-roll from P. aeruginosa alkaline protease with BRD1 and BRD2, highlighting the GGxGxDxUx repeat. Identical residues are indicated by an asterisk; B) The modeled structure of BRD1 highlighting the pair of tryptophan residues and two calcium-binding sites composed of residues Asp6, Asn15, Asp24 and Asp33; C) The back face of the BRD1 model showing the stacked Trp pair in more detail; D) The modeled structure of BRD2 highlighting the pair of tryptophan residues and four calcium-binding sites composed of residues Glu6, Asp15, Asp 21, Asn24 and Asp33 and Asp 42; E) The back face of the BRD2 model showing the stacked Trp pair in more detail.
Figure 3
Figure 3
Circular dichroism and 1D NMR data for BRD1 and 2. A) Circular dichroism spectra for a solution of BRD2 with (white circles) and without (black circles) 10 mM CaCl2 at room temperature. B) 1D NMR data for ~0.5 mM BRD1 in 90% H2O,10% D2O at pH 6.5. C) 1D NMR data for BRD1 as above plus 3.85 mM CaCl2. This figure shows the aromatic, amide NH, and indole NH region (6.0 to 11.0 ppm) of 600 MHz 1H NMR spectra.
Figure 4
Figure 4
Right angle light scattering timedrive plots for BRD1, 2 and control peptides/proteins in the presence of calcium or lanthanum and the maximum right angle light scattering responses using a variety of metal ions. The proteins were added at 200 s and the metals were introduced using a syringe pump starting at 500 s for a total of 120 s. A solution of EDTA was added to the cuvette using a syringe pump beginning at 1200 s until the right angle light scattering signal fell to its original level. A) Timedrive data for BRD1 with calcium (yellow line), BRD1 with lanthanum (red line), BRD2 with calcium (green line) and BRD2 with lanthanum (blue line). This plot illustrates that an increase in right angle light scattering (and therefore filament formation) is specific for peptides in solutions containing lanthanum and that it is a reversible process. This plot also highlights the larger increase in scattering for BRD2 over BRD1 at identical concentrations. B) Timedrives for a protein free control with lanthanum (purple line), a 15-mer peptide with α-helical propensity (red line), CAST (green line) and BRD2 with lanthanum (blue line) highlighting that the increase in right angle light scattering is specific to the BRD polypeptides only. C) A bar chart displaying maximum right angle light scattering responses at 320 nm for various metals at 10 mM final concentration in solutions containing 100 μM BRD2 peptide.
Figure 5
Figure 5
Negative-stained EM images of BRD1 and 2 filaments at 30,000 × magnification on Formvar-coated nickel grids. A) BRD1 filaments in a lanthanum solution; B) BRD2 in a lanthanum solution; C) BRD2 in a calcium solution; D) BRD2 in a lanthanum solution with EDTA added post filament formation. The images clearly show that filaments are only formed by BRD polypeptides in the presence of lanthanum and that they can be disassembled by the addition of EDTA.
Figure 6
Figure 6
Schematic representations of how BRD2 monomers could polymerise as long thin filaments. Key: N = N terminus, C = C terminus, F = Front Face, B = Back Face. A) The models are i) head-to-tail; ii) head-to-head and tail-to-tail; iii) front face to back face; iv) front face to front face and back face to back face. The favoured model for formation of very long filaments is the head-to-tail formation. B) Models of docked BRD2 monomers that are of the correct dimensions to form 3 nm diameter filaments that could extend over hundreds of nm. i) head-to-tail BRD2 monomers with their front faces all aligned on one side of the filament creating a bent polymer; ii) head-to-tail BRD2 monomers with their front faces on alternating sides of the filament creating a twisted polymer.
Figure 7
Figure 7
Right angle light scattering timedrive plots for BRD2, BioBRD2 and mixtures of the two peptides in the presence of lanthanum. The proteins were added at 100 (BRD2) and 200 s (BioBRD2) and the metals were introduced using a syringe pump starting at 500 s for a total of 120 s. A solution of EDTA was added to the cuvette using a syringe pump beginning at 1200 s until the right angle light scattering signal fell to its original level. A) Timedrive illustrating the relative right angle light scattering responses of 10 μM BRD2 (blue line) 10 μM (yellow line), 20 μM (purple line), 30 μM (green line) and 60 μM (red line) BioBRD2. It is clear that BioBRD2 does not produce increases in right angle light scattering comparable to BRD2, suggesting it does not form stable filaments. B) Timedrive illustrating the relative right angle light scattering responses of 10 μM BRD2 (blue line) BioBRD2 alone (yellow line), a 1 to 1 (cyan line), 1.5 to 1 (purple line), 4 to 1 (green line) and 9 to 1 (red line) excess of unmodified BRD2.
Figure 8
Figure 8
Negative stained EM images of BioBRD2 and BRD2 in lanthanum solution. A) BioBRD2 alone; B) 2:1 mixture of BRD2:BioBRD2; C) 20:1 mixture of BRD2:BioBRD 2; D) 40:1 mixture of BRD2:BioBRD2. These images at 30,000 × magnification on Formvar-coated nickel grids show the inverse relationship between the concentration of biotinylated BRD2 and the length of filaments formed. BioBRD2 does not form filaments in lanthanum solutions and it reduces the length and abundance of BRD2 filaments compared to identical conditions with BRD2 alone.
Figure 9
Figure 9
Plot of the average hydrodynamic radius (nm) against the amount of BioBRD2 (%) compared to unmodified BRD2. A 100% BioBRD2 sample represents a solution free of BRD2 while a 50% BioBRD2 solution corresponds to a 1 to 1 mixture of the two peptides. Y-axis error bars represent the standard deviation between three samples for each data point. Note the inverse correlation between increase in hydrodynamic radius and decreasing amount of BioBRD2.

Similar articles

Cited by

References

    1. Kobe B, Kajava AV. When protein folding is simplified to protein coiling: the continuum of solenoid protein structures. Trends Biochem Sci. 2000;25:509–515. doi: 10.1016/S0968-0004(00)01667-4. - DOI - PubMed
    1. Jenkins J, Pickersgill R. The architecture of parallel beta-helices and related folds. Prog Biophys Mol Biol. 2001;77:111–175. doi: 10.1016/S0079-6107(01)00013-X. - DOI - PubMed
    1. Sprang SR. On a (beta-) roll. Trends Biochem Sci. 1993;18:313–314. doi: 10.1016/0968-0004(93)90061-Q. - DOI - PubMed
    1. Ritter C, Maddelein ML, Siemer AB, Luhrs T, Ernst M, Meier BH, Saupe SJ, Riek R. Correlation of structural elements and infectivity of the HET-s prion. Nature. 2005;435:844–848. doi: 10.1038/nature03793. - DOI - PMC - PubMed
    1. Sen A, Baxa U, Simon MN, Wall JS, Sabate R, Saupe SJ, Steven AC. Mass analysis by scanning transmission electron microscopy and electron diffraction validate predictions of stacked beta-solenoid model of HET-s prion fibrils. J Biol Chem. 2007;282:5545–5550. doi: 10.1074/jbc.M611464200. - DOI - PubMed

Publication types

MeSH terms

LinkOut - more resources