. 2007 Jul 5;1(1):3.
doi: 10.1186/1753-4631-1-3.

Graph theoretical analysis of complex networks in the brain

Affiliations

Graph theoretical analysis of complex networks in the brain

Cornelis J Stam et al. Nonlinear Biomed Phys. .

Abstract

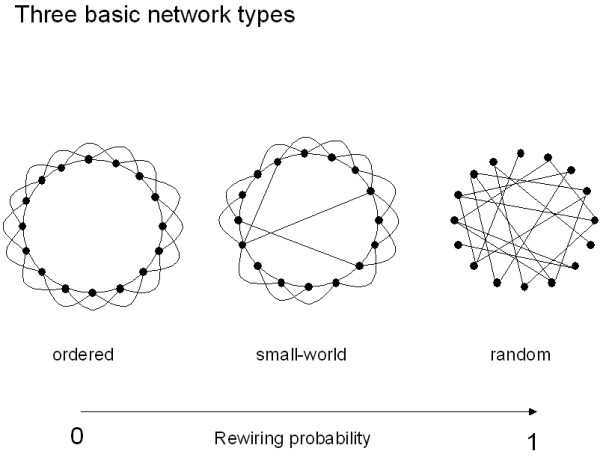
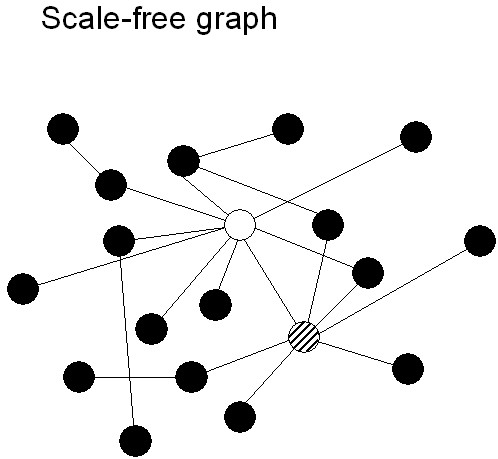
Since the discovery of small-world and scale-free networks the study of complex systems from a network perspective has taken an enormous flight. In recent years many important properties of complex networks have been delineated. In particular, significant progress has been made in understanding the relationship between the structural properties of networks and the nature of dynamics taking place on these networks. For instance, the 'synchronizability' of complex networks of coupled oscillators can be determined by graph spectral analysis. These developments in the theory of complex networks have inspired new applications in the field of neuroscience. Graph analysis has been used in the study of models of neural networks, anatomical connectivity, and functional connectivity based upon fMRI, EEG and MEG. These studies suggest that the human brain can be modelled as a complex network, and may have a small-world structure both at the level of anatomical as well as functional connectivity. This small-world structure is hypothesized to reflect an optimal situation associated with rapid synchronization and information transfer, minimal wiring costs, as well as a balance between local processing and global integration. The topological structure of functional networks is probably restrained by genetic and anatomical factors, but can be modified during tasks. There is also increasing evidence that various types of brain disease such as Alzheimer's disease, schizophrenia, brain tumours and epilepsy may be associated with deviations of the functional network topology from the optimal small-world pattern.


Figures

Figure 1
Figure 1
Representation of a network as a graph. In the case of an unweighted graph (left panel) black dots represent the nodes or vertices, and the lines connecting the dots the connections or edges. The shortest path between vertices A and B consists of three edges, indicted by the striped lines. The clustering coefficient of a vertex is the likelihood that its neighbours are connected. For vertex C, with neighbours B and D, the clustering coefficient is 1. When weights are assigned to the edges, the graph is weighted (right panel). Here the weights of the edges are indicated by the thickness of the lines.
Figure 2
Figure 2
Three basic network types in the model of Watts and Strogatz. The leftmost graph is a ring of 16 vertices (N = 16), where each vertex is connected to four neighbours (k = 4). This is an ordered graph which has a high clustering coefficient C and a long pathlength L. By choosing an edge at random, and reconnecting it to a randomly chosen vertex, graphs with increasingly random structure can be generated for increasing rewiring probability p. In the case of p = 1, the graph becomes completely random, and has a low clustering coefficient and a short pathlength. For small values of p so-called small-world networks arise, which combine the high clustering coefficient of ordered networks with the short pathlength of random networks.
Figure 3
Figure 3
Scale-free graphs are characterized by a scale-free degree distribution P(k). In scale-free graphs, different vertices have very different degrees, and typically a few vertices with extremely high degrees (so-called 'hubs') are present. In the schematic example shown here the white (k = 9) and the striped (k = 7) vertices are examples of hubs.
Figure 4
Figure 4
Schematic illustration of graph analysis applied to multi channel recordings of brain activity (fMRI, EEG or MEG). The first step (panel A) consists of computing a measure of correlation between all possible pairs of channels of recorded brain activity. The correlations can be represented in a correlation diagram (panel B, strength of correlation indicated with black white scale). Next a threshold is applied, and all correlations above the threshold are considered to be edges connecting vertices (channels). Thus, the correlation matrix is converted to a unweighted graph (panel C). From this graph various measures such as the clustering coefficient C and the path length L can be computed. For comparisons, random networks can be generated by shuffling the cells of the original correlation matrix of panel B. This shuffling preserves the symmetry of the matrix, and the mean strength of the correlations (panel D). From the random matrices graphs are constructed, and graph measures are computed as before. The mean values of the graph measures for the ensemble of random networks are determined. Finally, The ratio of the graph measures of the original network and the mean values of the graph measures of the random networks can be determined (panel F).

Similar articles

Cited by

References

    1. Sporns O, Honey Ch J. Small world inside big brains. PNAS. 2006;51:19219–19220. doi: 10.1073/pnas.0609523103. - DOI - PMC - PubMed
    1. Kandel ER, Schwartz JH, Jessell ThM. Principles of neural science. McGraw-Hill; 2000.
    1. Le van Quyen M. Disentangling the dynamic core: a research program for a neurodynamics at the large scale. Biol Res. 2003;36:67–88. - PubMed
    1. Amaral LAN, Ottino JM. Complex networks. Augmenting the framework for the study of complex systems. Eur Phys J B. 2004;38:147–162. doi: 10.1140/epjb/e2004-00110-5. - DOI
    1. Stam CJ. Nonlinear dynamical analysis of EEG and MEG: review of an emerging field. Clin Neurophysiol. 2005;116:2266–2301. doi: 10.1016/j.clinph.2005.06.011. - DOI - PubMed

LinkOut - more resources