

A2A receptor signaling promotes peripheral tolerance by inducing T-cell anergy and the generation of adaptive regulatory T cells
- PMID: 17909080
- PMCID: PMC2200810
- DOI: 10.1182/blood-2007-03-081646
A2A receptor signaling promotes peripheral tolerance by inducing T-cell anergy and the generation of adaptive regulatory T cells
Abstract
Tissue-derived adenosine, acting via the adenosine A(2A) receptor (A(2A)R), is emerging as an important negative regulator of T-cell function. In this report, we demonstrate that A(2A)R stimulation not only inhibits the generation of adaptive effector T cells but also promotes the induction of adaptive regulatory T cells. In vitro, antigen recognition in the setting of A(2A)R engagement induces T-cell anergy, even in the presence of costimulation. T cells initially stimulated in the presence of an A(2A)R agonist fail to proliferate and produce interleukin-2 and interferon (IFN)-gamma when rechallenged in the absence of A(2A)R stimulation. Likewise, in an in vivo model of autoimmunity, tissue-derived adenosine promotes anergy and abrogates tissue destruction. Indeed, A(2A)R stimulation inhibits interleukin-6 expression while enhancing the production of transforming growth factor-beta. Accordingly, treating mice with A(2A)R agonists not only inhibits Th1 and Th17 effector cell generation but also promotes the generation of Foxp3(+) and LAG-3(+) regulatory T cells. In this regard, A(2A)R agonists fail to prevent autoimmunity by LAG-3(-/-) clonotypic T cells, implicating an important role for LAG-3 in adenosine-mediated peripheral tolerance. Overall, our findings demonstrate that extracellular adenosine stimulates the A(2A)R to promote long-term T-cell anergy and the generation of adaptive regulatory T cells.
Figures
 and
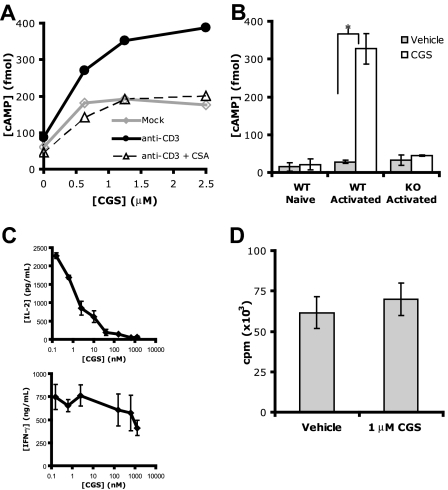
and  , respectively, *P < 0.05). (C) IL-2 (top) and IFN-γ (bottom) production of A.E7 T cells during activation with increasing doses of CGS. ID50 for IL-2 is 8 nM, and for IFN-γ 750 nM. (D) Proliferation of A.E7s with 0 or 1 μM of CGS. Data are representative of 3 separate experiments.
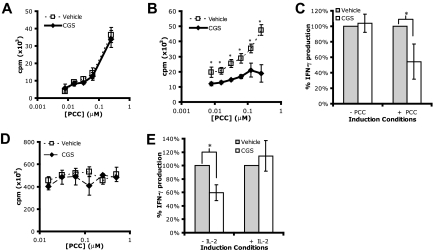 ) or presence () of 1 μM CGS. (D,E) Proliferation and IFN-γ production on rechallenge of A.E7s incubated with peptide and exogenous IL-2 in the absence or presence of 1 μM CGS. All rechallenges are done in the absence of CGS or exogenous IL-2. Data are representative of at least 3 independent experiments (*P < .05).
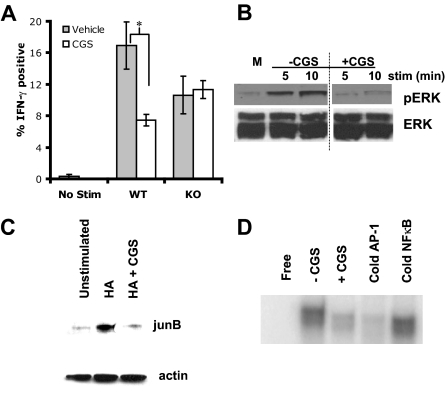 ) or presence () of 1 μM CGS during induction (*P < 0.05). (B) Representative Western blots for phospho-ERK and total ERK (top and bottom, respectively). Activated CD4+, 6.5+ primary T cells were stimulated with anti-CD3+ anti-CD28 in the absence or presence of 1 μM CGS. A vertical line has been inserted to indicate a repositioning of gel lanes from the same experiment. (C) Representative Western blots for junB, and actin (top and bottom, respectively). CD4+, 6.5+ primary T cells were stimulated with HA and irradiated APCs overnight in the absence or presence of 1 μM CGS. (D) Representative EMSA for AP-1. CD4+, 6.5+ primary T cells were stimulated with HA and irradiated APCs overnight in the absence or presence of 1 μM CGS. Data are representative of 3 independent experiments.
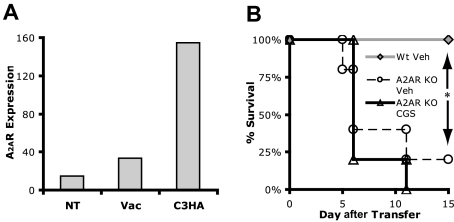
 ) or A2AR−/− 6.5+ T cells (○) (n = 5 each condition). Data are representative of 2 independent experiments.
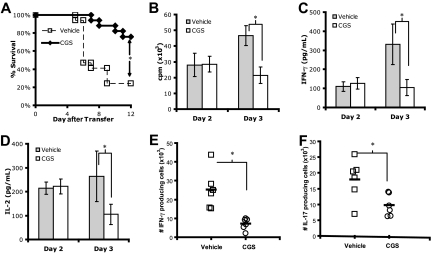 and , respectively). Data are representative of 2 independent experiments, ≥3 mice per group. (E,F) Number of IFN-γ (E) and IL-17 (F) lung-infiltrating 6.5+ T cells from C3HA mice given a lethal dose of autoreactive T cells. Data are a combination of 2 independent experiments, 3 mice per group (*P < .05).
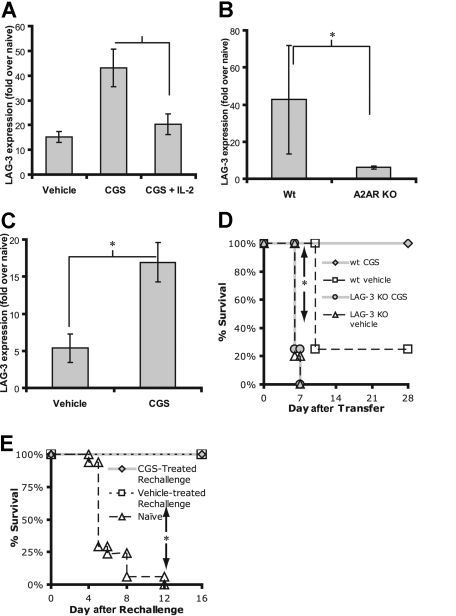 , [n = 13], respectively) are given a higher dose of 6.5+ T cells. Naive mice (▵, [n = 17]) received only this higher dose of 6.5+ T cells. No drug was administered during this phase of the experiment (*P < .05).
Similar articles
-
Extracellular adenosine regulates colitis through effects on lymphoid and nonlymphoid cells.Am J Physiol Gastrointest Liver Physiol. 2014 Aug 1;307(3):G338-46. doi: 10.1152/ajpgi.00404.2013. Epub 2014 May 29. Am J Physiol Gastrointest Liver Physiol. 2014. PMID: 24875104 Free PMC article.
-
Activation of adenosine 2A receptors attenuates allograft rejection and alloantigen recognition.J Immunol. 2007 Apr 1;178(7):4240-9. doi: 10.4049/jimmunol.178.7.4240. J Immunol. 2007. PMID: 17371980
-
Autocrine adenosine signaling promotes regulatory T cell-mediated renal protection.J Am Soc Nephrol. 2012 Sep;23(9):1528-37. doi: 10.1681/ASN.2012010070. Epub 2012 Jul 26. J Am Soc Nephrol. 2012. PMID: 22835488 Free PMC article.
-
Adenosine and anergy.Autoimmunity. 2007 Sep;40(6):425-32. doi: 10.1080/08916930701464939. Autoimmunity. 2007. PMID: 17729036 Review.
-
T cell anergy.Annu Rev Immunol. 2003;21:305-34. doi: 10.1146/annurev.immunol.21.120601.141110. Epub 2001 Dec 19. Annu Rev Immunol. 2003. PMID: 12471050 Review.
Cited by
-
Functional Mechanisms of Treg in the Context of HIV Infection and the Janus Face of Immune Suppression.Front Immunol. 2016 May 19;7:192. doi: 10.3389/fimmu.2016.00192. eCollection 2016. Front Immunol. 2016. PMID: 27242797 Free PMC article. Review.
-
Inhibition of HIF-1α enhances anti-tumor effects of dendritic cell-based vaccination in a mouse model of breast cancer.Cancer Immunol Immunother. 2016 Oct;65(10):1159-67. doi: 10.1007/s00262-016-1879-5. Epub 2016 Aug 6. Cancer Immunol Immunother. 2016. PMID: 27497816 Free PMC article.
-
Extracellular adenosine reversibly inhibits the activation of human regulatory T cells and negatively influences the achievement of the operational tolerance in liver transplantation.Am J Transplant. 2019 Jan;19(1):48-61. doi: 10.1111/ajt.15023. Epub 2018 Aug 31. Am J Transplant. 2019. PMID: 30019408 Free PMC article.
-
Adenosine receptor 2a agonists target mouse CD11c+T-bet+ B cells in infection and autoimmunity.Nat Commun. 2022 Jan 21;13(1):452. doi: 10.1038/s41467-022-28086-1. Nat Commun. 2022. PMID: 35064115 Free PMC article.
-
In vitro induction of T cells that are resistant to A2 adenosine receptor-mediated immunosuppression.Br J Pharmacol. 2009 Jan;156(2):297-306. doi: 10.1111/j.1476-5381.2008.00019.x. Epub 2008 Dec 9. Br J Pharmacol. 2009. PMID: 19076726 Free PMC article.
References
-
- Sitkovsky MV, Lukashev D, Apasov S, et al. Physiological control of immune response and inflammatory tissue damage by hypoxia-inducible factors and adenosine A2A receptors. Annu Rev Immunol. 2004;22:657–682. - PubMed
-
- Sitkovsky MV. Use of the A(2A) adenosine receptor as a physiological immunosuppressor and to engineer inflammation in vivo. Biochem Pharmacol. 2003;65:493–501. - PubMed
-
- Lappas CM, Sullivan GW, Linden J. Adenosine A2A agonists in development for the treatment of inflammation. Expert Opin Invest Drugs. 2005;14:797–806. - PubMed
-
- Ohta A, Sitkovsky M. Role of G-protein-coupled adenosine receptors in downregulation of inflammation and protection from tissue damage. Nature. 2001;414:916–920. - PubMed
-
- Redmond WL, Sherman LA. Peripheral tolerance of CD8 T lymphocytes. Immunity. 2005;22:275–284. - PubMed
Publication types
MeSH terms
Substances
Grants and funding
LinkOut - more resources
Full Text Sources
Other Literature Sources
Molecular Biology Databases
