

Diagnostic accuracy of MALDI mass spectrometric analysis of unfractionated serum in lung cancer
- PMID: 17909350
- PMCID: PMC4220686
- DOI: 10.1097/JTO.0b013e31814b8be7
Diagnostic accuracy of MALDI mass spectrometric analysis of unfractionated serum in lung cancer
Abstract
Purpose: There is a critical need for improvements in the noninvasive diagnosis of lung cancer. We hypothesized that matrix-assisted laser desorption ionization mass spectrometry (MALDI MS) analysis of the most abundant peptides in the serum may distinguish lung cancer cases from matched controls.
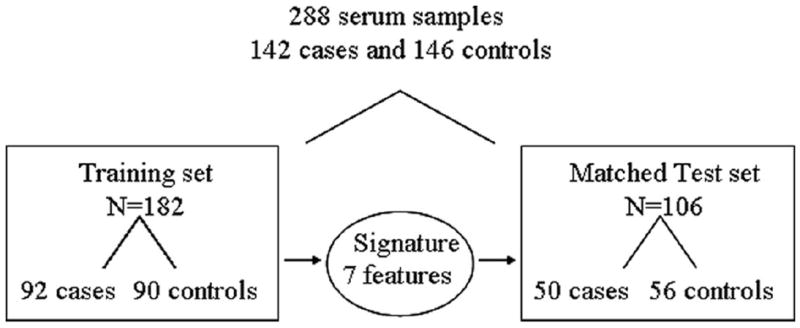
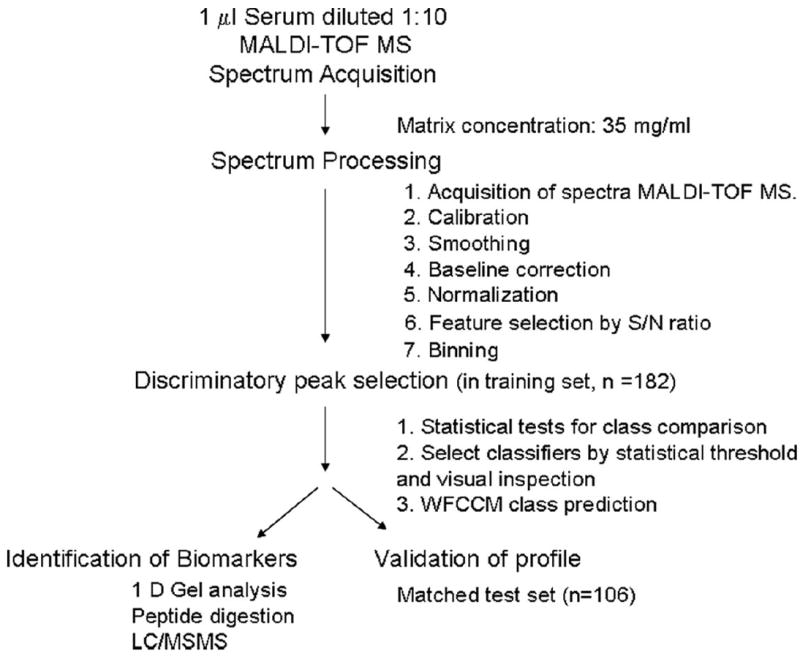
Patients and methods: We used MALDI MS to analyze unfractionated serum from a total of 288 cases and matched controls split into training (n = 182) and test sets (n = 106). We used a training-testing paradigm with application of the model profile defined in a training set to a blinded test cohort.
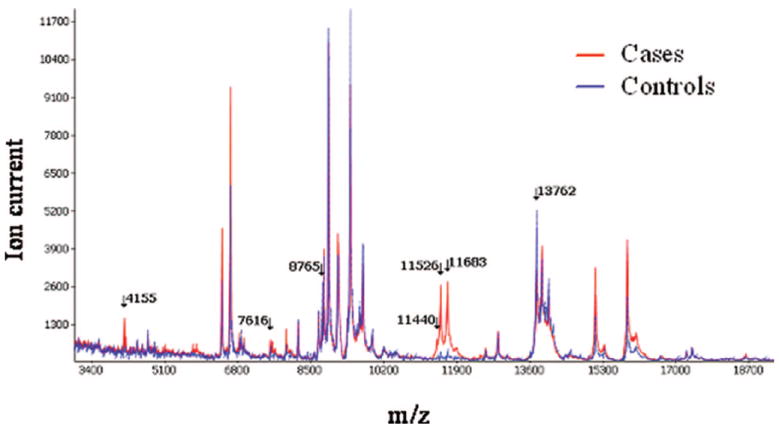
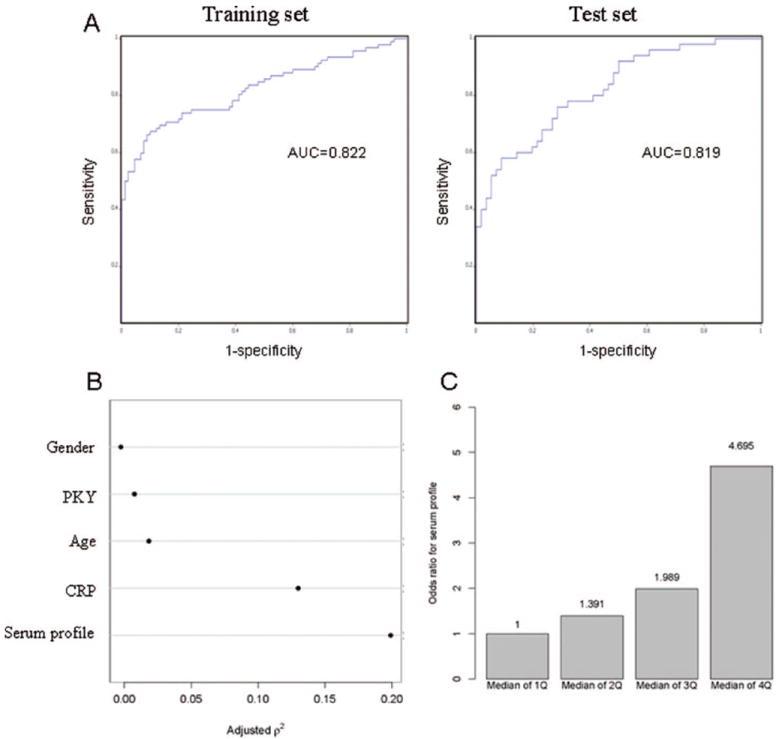
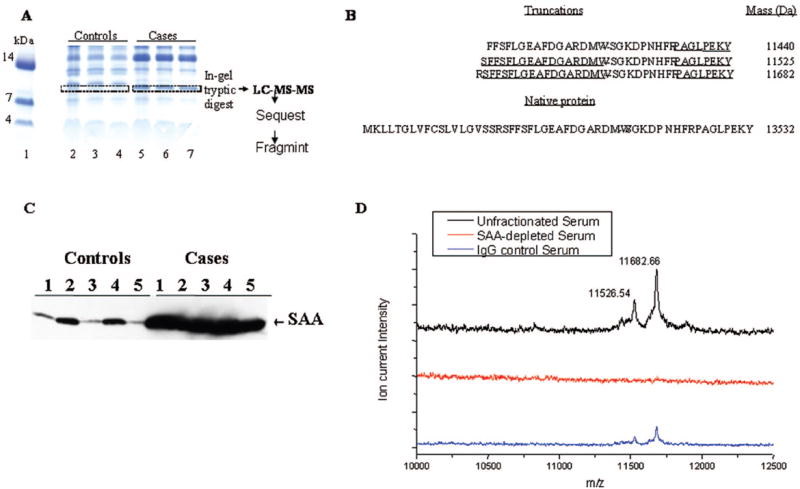
Results: Reproducibility and lack of analytical bias was confirmed in quality-control studies. A serum proteomic signature of seven features in the training set reached an overall accuracy of 78%, a sensitivity of 67.4%, and a specificity of 88.9%. In the blinded test set, this signature reached an overall accuracy of 72.6 %, a sensitivity of 58%, and a specificity of 85.7%. The serum signature was associated with the diagnosis of lung cancer independently of gender, smoking status, smoking pack-years, and C-reactive protein levels. From this signature, we identified three discriminatory features as members of a cluster of truncated forms of serum amyloid A.
Conclusions: We found a serum proteomic profile that discriminates lung cancer from matched controls. Proteomic analysis of unfractionated serum may have a role in the noninvasive diagnosis of lung cancer and will require methodological refinements and prospective validation to achieve clinical utility.
Figures
Similar articles
-
[Application of serum surface-enhanced laser desorption/ionization proteomic patterns in distinguishing non-small cell lung cancer patients from healthy people].Zhonghua Jie He He Hu Xi Za Zhi. 2006 Jan;29(1):31-4. Zhonghua Jie He He Hu Xi Za Zhi. 2006. PMID: 16638298 Chinese.
-
Serum proteomic profiling of lung cancer in high-risk groups and determination of clinical outcomes.J Thorac Oncol. 2008 Aug;3(8):840-50. doi: 10.1097/JTO.0b013e31817e464a. J Thorac Oncol. 2008. PMID: 18670301
-
A 25-signal proteomic signature and outcome for patients with resected non-small-cell lung cancer.J Natl Cancer Inst. 2007 Jun 6;99(11):858-67. doi: 10.1093/jnci/djk197. J Natl Cancer Inst. 2007. PMID: 17551146 Clinical Trial.
-
Serum tumour markers in lung cancer.Scand J Clin Lab Invest Suppl. 1991;206:93-101. doi: 10.3109/00365519109107730. Scand J Clin Lab Invest Suppl. 1991. PMID: 1658919 Review. No abstract available.
-
Statistical design for biospecimen cohort size in proteomics-based biomarker discovery and verification studies.J Proteome Res. 2013 Dec 6;12(12):5383-94. doi: 10.1021/pr400132j. Epub 2013 Oct 28. J Proteome Res. 2013. PMID: 24063748 Free PMC article.
Cited by
-
Added value of a serum proteomic signature in the diagnostic evaluation of lung nodules.Cancer Epidemiol Biomarkers Prev. 2012 May;21(5):786-92. doi: 10.1158/1055-9965.EPI-11-0932. Epub 2012 Feb 28. Cancer Epidemiol Biomarkers Prev. 2012. PMID: 22374995 Free PMC article.
-
Noninvasive biomarkers for lung cancer diagnosis, where do we stand?J Thorac Dis. 2020 Jun;12(6):3317-3330. doi: 10.21037/jtd-2019-ndt-10. J Thorac Dis. 2020. PMID: 32642255 Free PMC article. Review.
-
Performance of a multiplexed dual analyte immunoassay for the early detection of non-small cell lung cancer.J Transl Med. 2015 Feb 12;13:55. doi: 10.1186/s12967-015-0419-y. J Transl Med. 2015. PMID: 25880432 Free PMC article.
-
Blood-based lung cancer biomarkers identified through proteomic discovery in cancer tissues, cell lines and conditioned medium.Clin Proteomics. 2015 Jul 16;12(1):18. doi: 10.1186/s12014-015-9090-9. eCollection 2015. Clin Proteomics. 2015. PMID: 26279647 Free PMC article.
-
The impact of the lung EDRN-CVC on Phase 1, 2, & 3 biomarker validation studies.Cancer Biomark. 2022;33(4):449-465. doi: 10.3233/CBM-210382. Cancer Biomark. 2022. PMID: 35491773 Free PMC article.
References
-
- Jemal A, Murray T, Ward E, et al. Cancer statistics, 2005. CA Cancer J Clin. 2005;55:10–30. - PubMed
-
- Kulpa J, Wojcik E, Reinfuss M, Kolodziejski L. Carcinoembryonic antigen, squamous cell carcinoma antigen, CYFRA 21-1, and neuron-specific enolase in squamous cell lung cancer patients. Clin Chem. 2002;48:1931–1937. - PubMed
-
- Pastor A, Menendez R, Cremades MJ, Pastor V, Llopis R, Aznar J. Diagnostic value of SCC, CEA and CYFRA 21.1 in lung cancer: a Bayesian analysis. Eur Respir J. 1997;10:603–609. - PubMed
-
- Seemann MD, Beinert T, Furst H, Fink U. An evaluation of the tumour markers, carcinoembryonic antigen (CEA), cytokeratin marker (CYFRA 21-1) and neuron-specific enolase (NSE) in the differentiation of malignant from benign solitary pulmonary lesions. Lung Cancer. 1999;26:149–155. - PubMed
-
- Chaurand P, Stoeckli M, Caprioli RM. Direct profiling of proteins in biological tissue sections by MALDI mass spectrometry. Anal Chem. 1999;71:5263–5270. - PubMed
Publication types
MeSH terms
Substances
Grants and funding
LinkOut - more resources
Full Text Sources
Other Literature Sources
Medical
Research Materials
