. 2007 Oct;117(10):3020-8.
doi: 10.1172/JCI31935.

Macrophages suppress T cell responses and arthritis development in mice by producing reactive oxygen species

Affiliations

Macrophages suppress T cell responses and arthritis development in mice by producing reactive oxygen species

Kyra A Gelderman et al. J Clin Invest. 2007 Oct.

Abstract

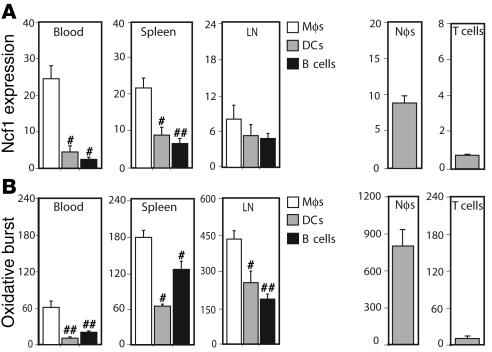
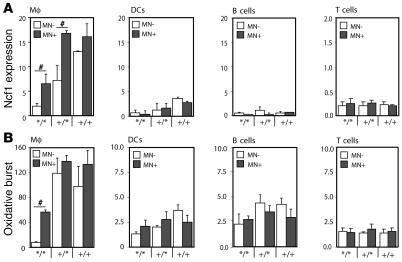
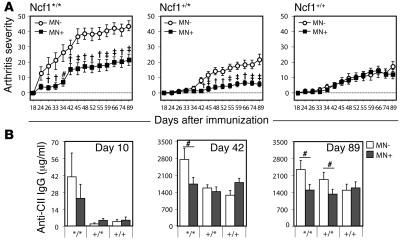
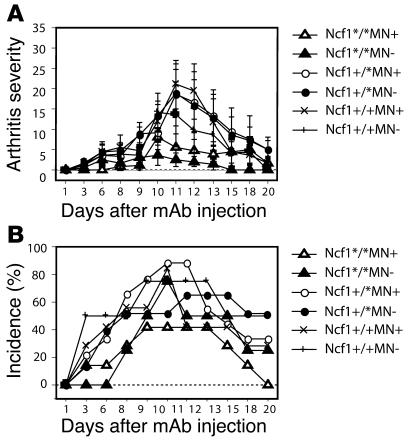
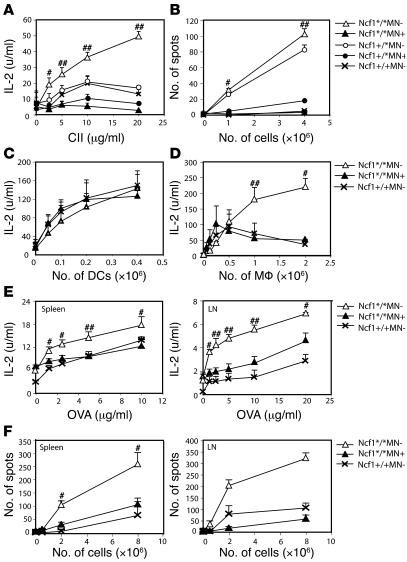
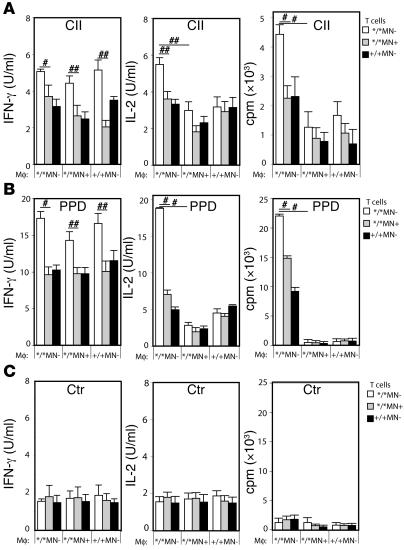
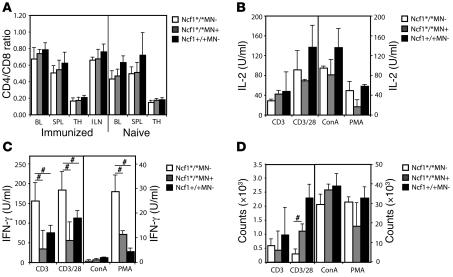
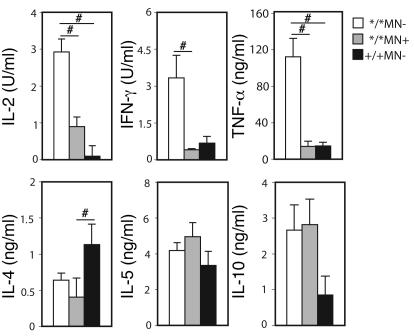
Reduced capacity to produce ROS increases the severity of T cell-dependent arthritis in both mice and rats with polymorphisms in neutrophil cytosolic factor 1 (Ncf1) (p47phox). Since T cells cannot exert oxidative burst, we hypothesized that T cell responsiveness is downregulated by ROS produced by APCs. Macrophages have the highest burst capacity among APCs, so to study the effect of macrophage ROS on T cell activation, we developed transgenic mice expressing functional Ncf1 restricted to macrophages. Macrophage-restricted expression of functional Ncf1 restored arthritis resistance to the level of that of wild-type mice in a collagen-induced arthritis model but not in a T cell-independent anti-collagen antibody-induced arthritis model. T cell activation was downregulated and skewed toward Th2 in transgenic mice. In vitro, IL-2 production and T cell proliferation were suppressed by macrophage ROS, irrespective of T cell origin. IFN-gamma production, however, was independent of macrophage ROS but dependent on T cell origin. These effects were antigen dependent but not restricted to collagen type II. In conclusion, macrophage-derived ROS play a role in T cell selection, maturation, and differentiation, and also a suppressive role in T cell activation, and thereby mediate protection against autoimmune diseases like arthritis.


Figures

Figure 1
Figure 1. Macrophages are the APCs with the highest Ncf1 expression and oxidative burst capacity.
Expression levels of Ncf1 in APCs (A) and their ability to exert oxidative burst (B) were determined in cells from naive B10.Q mice. Macrophages (Mφ: F4/80+CD11c) showed significantly higher levels of Ncf1 expression and oxidative burst induced by PMA as compared with DCs (F4/80CD11c+) and B cells (B220+CD11b) in blood, spleen, and inguinal LNs. Means ± SEM are shown of 6 animals per group. Asterisks indicate significantly lower expression or burst as compared with macrophages: #P < 0.05; ##P < 0.01. Ncf1 expression and burst of blood neutrophils (Nφ: Gr1+F4/80) and T cells (T: CD4+CD3+) are shown as positive and negative controls, respectively.
Figure 2
Figure 2. Transgenic mice show increased Ncf1 expression and burst by macrophages only.
(A) Expression levels of Ncf1 were determined in B10.QMN transgenic mice, expressing functional Ncf1 under control of the human CD68 promoter on an Ncf1 mutant (*/*), heterozygous (+/*), or wild-type (+/+) background. Spleen macrophages (F4/80+CD11c-) express significantly higher levels of Ncf1 when positive for the transgene (black bars: MN+) as compared with transgene-negative mice (white bars: MN). This difference in Ncf1 expression was not observed in DCs (F4/80CD11c+), B cells (B220+CD11b), or CD4+ T cells (CD3+CD4+). (B) Accordingly, macrophages from Ncf1*/* transgene–positive (MN+) mice were able to exert oxidative burst that was significantly higher than in transgene-negative (MN) mice. This difference was not observed in DCs, B cells, or T cells. Mean ± SEM of 4 mice are shown. #P < 0.05.
Figure 3
Figure 3. ROS production by macrophages decreases arthritis severity.
(A) Mice expressing functional Ncf1 on macrophages only (Ncf1*/*MN+: filled squares; n = 23) developed significantly less severe CIA as compared with Ncf1*/*MN (open circles; n = 15) mice. After boost at day 35, a similar difference was also observed between Ncf1 heterozygous (+/*) mice with (n = 34) or without (n = 29) the transgene. No differences were observed in Ncf1 wild-type (+/+; n = 21 and 27) mice. All groups were included in each experiment. Mean ± SEM are shown of all mice, run in 2 different experiments with exactly the same setup, with the indicated total number of mice per group. #P < 0.05; P < 0.005; P < 0.0005. (B) Anti-CII IgG levels were determined at 10, 42, and 89 days after immunization and were significantly lower in transgene-positive (MN+) Ncf1*/* mice as compared with transgene-negative (MN) Ncf1*/* mice. Sera from the CIA experiments as shown in A were used, with similar numbers of mice as indicated there. Means ± SEM are shown.
Figure 4
Figure 4. ROS produced by macrophages do not affect the inflammatory phase.
CAIA was induced by injecting 4 mg of a 4 mAb cocktail reactive with CII i.v. into B10.QMN mice. LPS was injected 7 days later (day 7). Arthritis severity and incidence were determined over time. Mean ± SEM are shown. No significant differences between transgene-positive or -negative mice were observed for either Ncf1 genotype (Ncf1*/* MN, n = 7; MN+, n = 6; Ncf1+/* MN, n = 9; MN+, n = 8; Ncf1+/+ MN, n = 6; MN+, n = 3).
Figure 5
Figure 5. Mice with mutated Ncf1 in macrophages have more and more active anti-CII T cells.
Spleen cells from B10.QMN mice immunized 10 days earlier with CII were restimulated with lathCII, and levels of IL-2 present in the supernatant were measured by ELISA. (A) Ncf1 mutant (*/*) and heterozygous (+/*) transgene-negative mice (MN) produced significantly more IL-2 compared with transgene-positive (MN+) mice. (B) Cells from the same spleens were subjected to IFN-γ ELISPOT. The number of spots after restimulation with lathCII was significantly lower in transgenic mice. (C) DCs grown from bone marrow with GM-CSF and matured with LPS induced similar amounts of IL-2 production by HCQ10 hybridoma T cells, irrespective of transgene or Ncf1 genotype. (D) In contrast, p-macrophages (pMφ) from Ncf1*/*MN+ and Ncf1+/+MN mice induced lower levels of IL-2 production by HCQ10 compared with Ncf1*/*MN mice. IL-2 (E) and IFN-γ (F) production after immunization and in vitro restimulation with OVA was higher in Ncf1*/*MN mice compared with Ncf1*/*MN+ and Ncf1+/+ mice in both spleen and LNs. For A, B, E, and F, means ± SEM of 2 experiments with 3 mice per group are shown. C and D show the results of 1 out of 2 representative experiments each with 4 mice per group. #P < 0.05; ##P < 0.01.
Figure 6
Figure 6. Macrophage ROS suppress IL-2 but not IFN-γ production by Ncf1 mutant T cells.
Purified CD4+ T cells from CII immunized Ncf1*/*MN (white bars), Ncf1*/*MN+ (gray bars), and Ncf1+/+MN (black bars) were incubated with purified p-macrophages from naive mice from the same genotypes (depicted on the x axes) in all 9 combinations and restimulated with lathCII (A), PPD (B), or nothing (Ctr) (C). IFN-γ production, IL-2 production, and the proliferative response were determined. IFN-γ production was increased in all conditions with Ncf1*/*MN T cells whereas IL-2 production and proliferation were suppressed by macrophages originating from Ncf1*/*MN+ or Ncf1+/+MN mice. Means ± SEM of 6-8 mice per group obtained from 3 different experiments are shown. #P < 0.05, ##P < 0.01.
Figure 7
Figure 7. IL-2 production and proliferation do not differ after T cell stimulation with anti-CD3 or mitogen.
(A) T cell numbers (CD3+CD4+ and CD3+CD8+) were measured by flow cytometry in different immune compartments (BL, blood; SPL, spleen; TH, thymus; ILN, inguinal LNs) from naive mice and mice immunized 10 days previously and depicted as CD4/CD8 ratio; there were no differences between the genotypes. (BD) Stimulation of splenocytes from naive mice with anti-CD3 (10 μg/ml), anti-CD3 plus anti-CD28 (2 μg/ml), ConA (3 μg/ml), or PMA (50 ng/ml) did not result in different levels of IL-2 production or proliferation, but IFN-γ production by Ncf1*/*MN mice was significantly higher compared with Ncf1*/*MN+ or Ncf1+/+MN mice, except for the ConA stimulation. Mean ± SEM are shown from 4 mice per genotype for all conditions, #P < 0.05.
Figure 8
Figure 8. Ncf1 mutated nontransgenic mice have a more pronounced Th1 response.
Spleen cells from mice immunized with CII were restimulated with lathCII in vitro, and levels of IL-2, IFN-γ, TNF-α, IL-4, IL-5, and IL-10 were determined in the supernatant. Mean ± SEM of 5–6 mice per group are shown. #P < 0.05.

References

    1. Feldmann M., Brennan F.M., Maini R.N. Rheumatoid arthritis. Cell. 1996;85:307–310. - PubMed
    1. MacGregor A.J., et al. Characterizing the quantitative genetic contribution to rheumatoid arthritis using data from twins. Arthritis Rheum. . 2000;43:30–37. - PubMed
    1. Johannesson M., Hultqvist M., Holmdahl R. Genetics of autoimmune diseases: a multistep process. Curr. Top. Microbiol.Immunol. 2006;305:259–276. - PubMed
    1. Hultqvist M., et al. Enhanced autoimmunity, arthritis, and encephalomyelitis in mice with a reduced oxidative burst due to a mutation in the Ncf1 gene. Proc. Natl. Acad. Sci. U. S. A. 2004;101:12646–12651. - PMC - PubMed
    1. Olofsson P., Holmberg J., Tordsson J., Lu S., Akerstrom B., Holmdahl R. Positional identification of Ncf1 as a gene that regulates arthritis severity in rats. Nat. Genet. 2003;33:25–32. - PubMed

Publication types