Comparative Study
. 2007 Oct 2:8:368.
doi: 10.1186/1471-2105-8-368.

Assessment of algorithms for high throughput detection of genomic copy number variation in oligonucleotide microarray data

Affiliations
Comparative Study

Assessment of algorithms for high throughput detection of genomic copy number variation in oligonucleotide microarray data

Agnes Baross et al. BMC Bioinformatics. .

Abstract

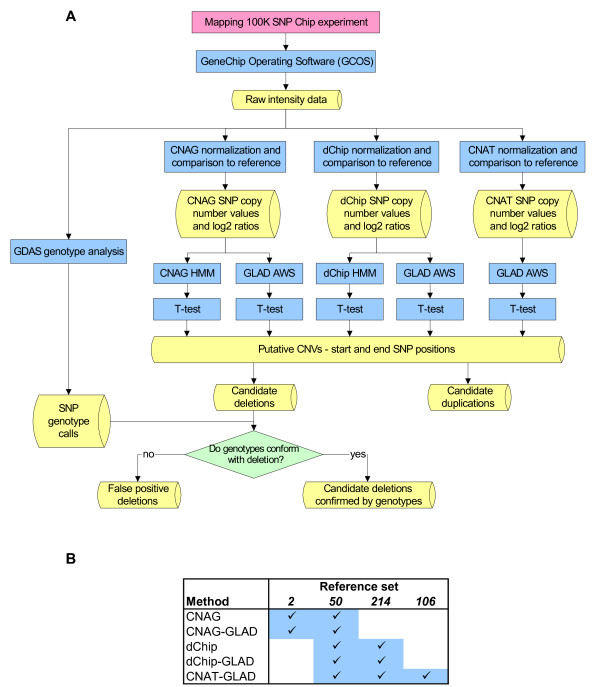
Background: Genomic deletions and duplications are important in the pathogenesis of diseases, such as cancer and mental retardation, and have recently been shown to occur frequently in unaffected individuals as polymorphisms. Affymetrix GeneChip whole genome sampling analysis (WGSA) combined with 100 K single nucleotide polymorphism (SNP) genotyping arrays is one of several microarray-based approaches that are now being used to detect such structural genomic changes. The popularity of this technology and its associated open source data format have resulted in the development of an increasing number of software packages for the analysis of copy number changes using these SNP arrays.

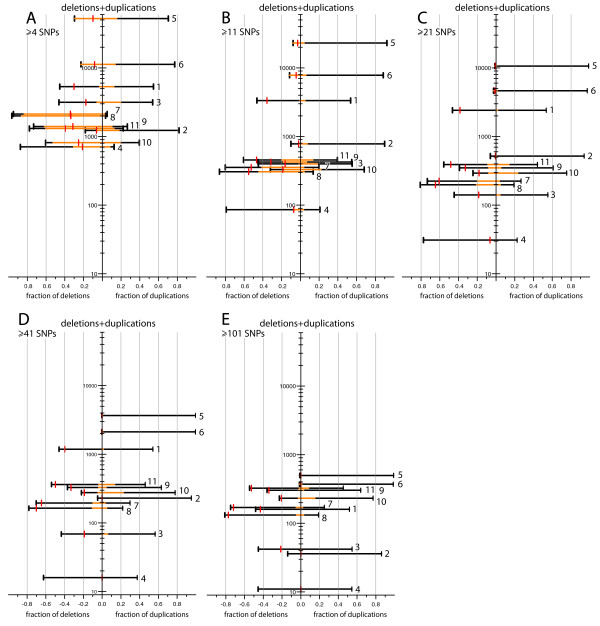
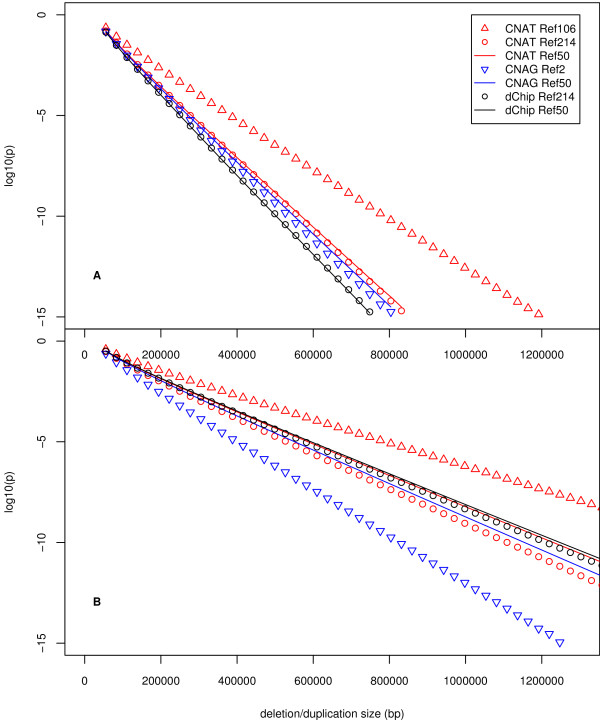
Results: We evaluated four publicly available software packages for high throughput copy number analysis using synthetic and empirical 100 K SNP array data sets, the latter obtained from 107 mental retardation (MR) patients and their unaffected parents and siblings. We evaluated the software with regards to overall suitability for high-throughput 100 K SNP array data analysis, as well as effectiveness of normalization, scaling with various reference sets and feature extraction, as well as true and false positive rates of genomic copy number variant (CNV) detection.

Conclusion: We observed considerable variation among the numbers and types of candidate CNVs detected by different analysis approaches, and found that multiple programs were needed to find all real aberrations in our test set. The frequency of false positive deletions was substantial, but could be greatly reduced by using the SNP genotype information to confirm loss of heterozygosity.


Figures

Figure 1
Figure 1
Overview of the data analysis process. A) Methods appear in blue, and data in yellow. B) The reference sets used for each analysis method are as follows. '2': within each MR trio (child, mother and father), three comparisons were done – child to father as reference, child to mother as reference, and father to mother as reference. '50': each sample was compared to a reference set of 50 unaffected mothers of children with MR. These 50 mothers selected for this reference set had the lowest numbers of CNVs detected by dChip compared to other mothers. '214': each sample was compared to a reference set that included all 214 unaffected parents (107 mothers and 107 fathers) of the children with MR. '106': a default reference set of 106 individuals provided by Affymetrix for copy number analysis with CNAT [18].
Figure 2
Figure 2
Size distribution of candidate CNVs detected. The five plots show numbers of candidate copy number gains and losses identified using Xba and Hind arrays, arranged according to the numbers of SNPs within the aberrations: A) all CNVs (>= 4 SNPs); B) CNVs >= 11 SNPs; C) CNVs >= 21 SNPs; D) CNVs >= 41 SNPs and E) CNVs >= 101 SNPs. The y-axis value of each horizontal line represents the total number of CNVs detected by a given method: 1 – CNAG Ref2; 2 – CNAG Ref50; 3 – CNAG-GLAD Ref2; 4 – CNAG-GLAD Ref50; 5 – dChip Ref50; 6 – dChip Ref214; 7 – dChip-GLAD Ref50; 8 – dChip-GLAD Ref214; 9 – CNAT-GLAD Ref50; 10 – CNAT-GLAD Ref106; 11 – CNAT-GLAD Ref214 (the reference sets are described in Figure 1 and in the Methods.) The left and right side of each panel correspond to the fraction of deletions and duplications, respectively. The orange bars within the black lines show the fraction of CNVs that passed the following confidence thresholds: p <= 0.05 (t-test) and copy number < 1.25 for deletions (left); or p <= 0.05 (t-test) and copy number > 2.75 for duplications (right). The fractions of false positive deletion calls, calculated based on SNP heterozygosity, are indicated by the red vertical bars on the left side of each panel. For example, the y-axis value of the top line (5) in plot 'A' indicates the total number of candidate CNVs (52,478) including at least 4 consecutive SNPs identified by dChip Ref50 (from Xba and Hind data). 30% of the 52,478 putative CNVs were deletions (left) and 70% were duplications (right). 99% of the deletions (orange fraction of the line, left) and 22% of the duplications (orange fraction of the line, right) passed our p-value <= 0.05 and copy number (<1.25 or >2.75) thresholds described above. 34% of the candidate deletions were considered to be false positives, indicated by the red bar (left).
Figure 3
Figure 3
Theoretical resolving power of CNAG, dChip and CNAT with reference sets of 2, 50, 106 and 214 (see Methods and Figure 1 legend). The resolving power was defined as the average size of the smallest one-copy deletion or duplication that could be detected with a given method at a given confidence level. The theoretical p-value (in log10 scale) is shown as a function of the deletion (A) or duplication (B) size detected from Affymetrix GeneChip 100 K Xba and Hind data. For a given p-value, e.g. 10-5, the theoretical minimum size of detectable deletion or duplication is shown for each method. For a deletion or duplication of a given size, e.g. 400,000 bp, the theoretical p-values are shown for each method.

Similar articles

Cited by

References

    1. Kops GJ, Weaver BA, Cleveland DW. On the road to cancer: aneuploidy and the mitotic checkpoint. Nat Rev Cancer. 2005;5:773–785. doi: 10.1038/nrc1714. - DOI - PubMed
    1. Fukasawa K. Centrosome amplification, chromosome instability and cancer development. Cancer Lett. 2005;230:6–19. doi: 10.1016/j.canlet.2004.12.028. - DOI - PubMed
    1. Duesberg P, Li R, Fabarius A, Hehlmann R. The chromosomal basis of cancer. Cell Oncol. 2005;27:293–318. - PMC - PubMed
    1. Leonard H, Wen X. The epidemiology of mental retardation: challenges and opportunities in the new millennium. Ment Retard Dev Disabil Res Rev. 2002;8:117–134. doi: 10.1002/mrdd.10031. - DOI - PubMed
    1. van Karnebeek CD, Jansweijer MC, Leenders AG, Offringa M, Hennekam RC. Diagnostic investigations in individuals with mental retardation: a systematic literature review of their usefulness. Eur J Hum Genet. 2005;13:6–25. doi: 10.1038/sj.ejhg.5201279. - DOI - PubMed

Publication types

LinkOut - more resources