

Review
doi: 10.1366/000370207781746044.
Coherent anti-Stokes Raman scattering microscopy
Affiliations
- PMID: 17910784
- PMCID: PMC2642972
- DOI: 10.1366/000370207781746044
Item in Clipboard
Review
Coherent anti-Stokes Raman scattering microscopy
Appl Spectrosc.
2007 Sep.
No abstract available
Figures
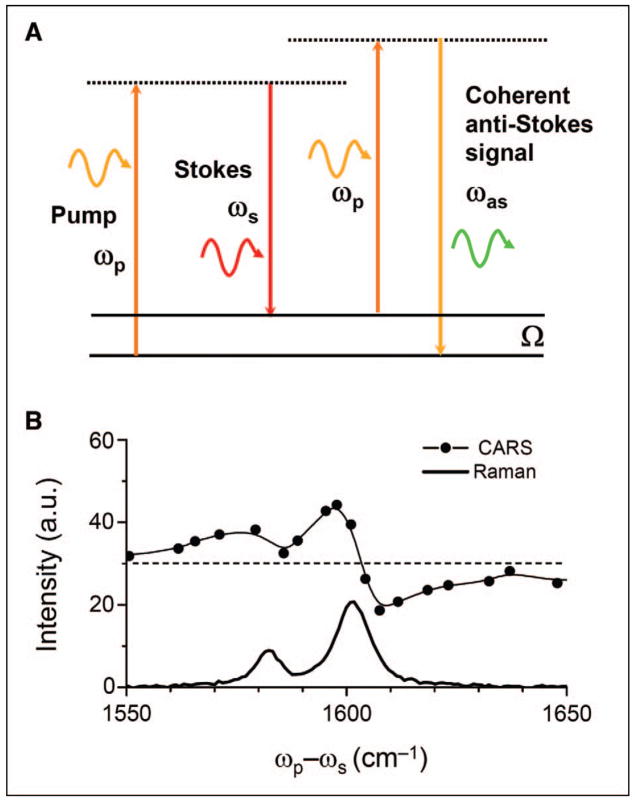
(A) Energy diagram of CARS. (B) CARS and Raman spectra of polystyrene in the 1550 to 1650 cm−1 region. The nonresonant background is indicated by the dashed line. The red shift of the CARS peaks and the dip at 1608 cm−1 result from the interference between the resonant signal and the nonresonant background.
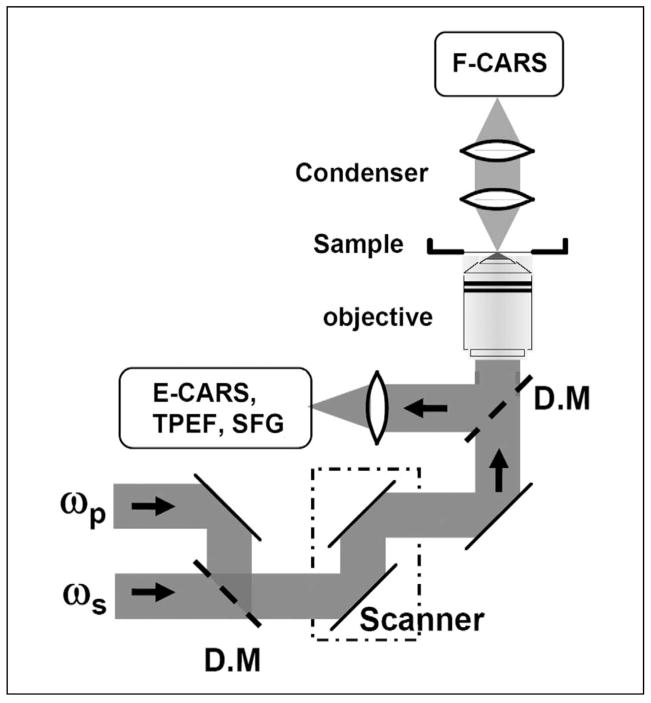
Schematic of a laser-scanning CARS microscope that allows imaging with forward-detected CARS (F-CARS), epi-detected CARS (E-CARS), two-photon excitation fluorescence (TPEF), and sum frequency generation (SFG) signals produced by two synchronized pulsed lasers at frequencies ωp and ωs. D.M, dichroic mirror.
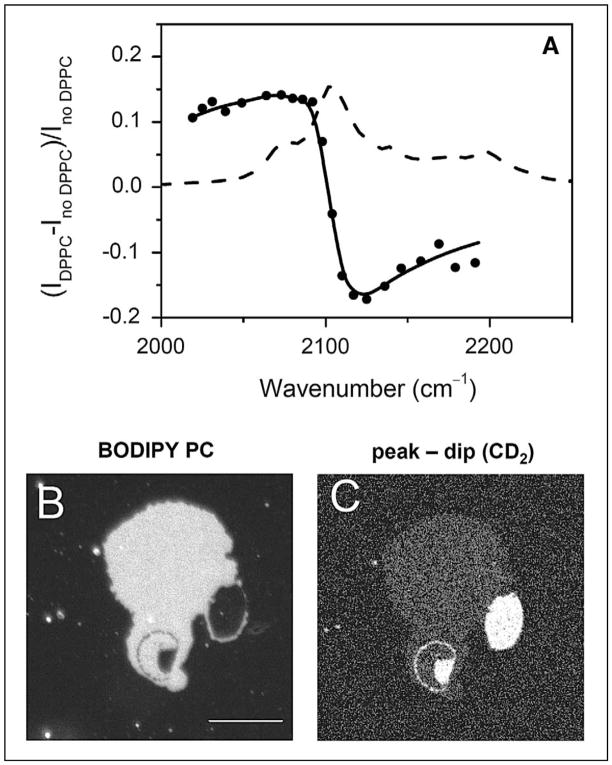
E-CARS imaging of lipid domains in a supported bilayer. (A) E-CARS spectral profile (solid line with solid circles) of a single supported bilayer of d62-DPPC in the C–D stretch vibration region. The peak and dip of the CARS band appeared at 2080 cm−1 and 2125 cm−1, respectively. The Raman spectrum (dashed line) of bulk d62-DPPC is also shown as a reference. (B) Fluorescence image of a DOPC/d62-DPPC (1:1) bilayer patch. Image was acquired at 23 °C. The liquid phase was labeled by BODIPY PC. (C) The (peak − dip) CARS image of the same sample, obtained by subtracting the CARS image at 2125 cm−1 from that at 2080 cm−1. The gel phase that is enriched in d62-DPPC exhibited a bright CARS contrast. Bar length = 10 μm. Data adapted from the paper by Li et al.
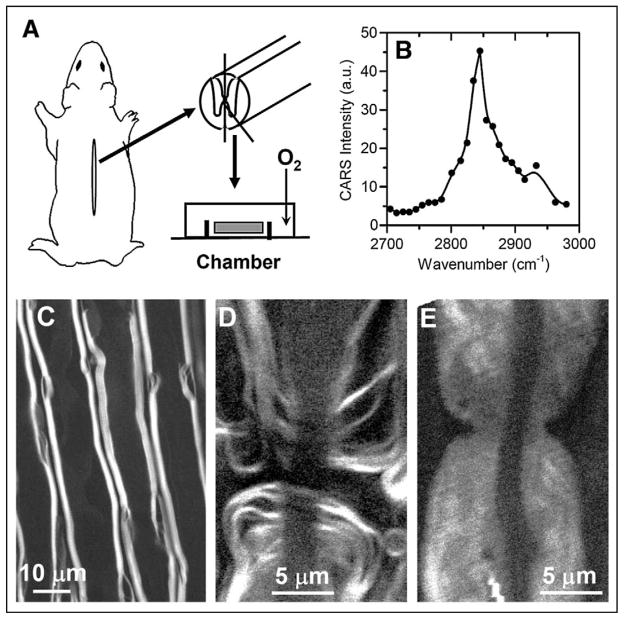
CARS imaging of intact myelin sheath. (A) Schematic showing the procedure of extracting spinal cord white matter from a guinea pig. (B) CARS spectral profile of myelin. (C) Forward detected CARS (F-CARS) image of myelin sheath surrounding parallel axons in an ex vivo spinal tissue. (D) F-CARS image of a node of Ranvier. (E) F-CARS image of nodal myelin swelling induced by lysophosphatidylcholine. For all images, (ωp − ωs) was tuned to 2845 cm−1.
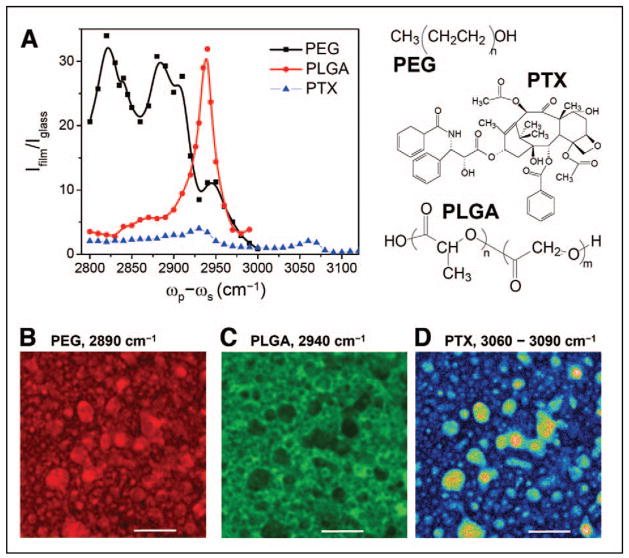
CARS imaging of paclitaxel (PTX) distribution in a PEG/PLGA blend film. (A) CARS spectral profiles of PEG, PLGA, and PTX in the CH stretch vibration region. The molecular structures are shown on the right side. (B, C) Distribution of PEG and PLGA based on the CARS signals from CH2, CH3, and aromatic CH vibration bands, respectively. (D) PTX distribution. Image was obtained by subtracting the CARS image at 3090 cm−1 from that at 3060 cm−1. Bar = 5 μm. Data adapted from the paper by Kang et al.
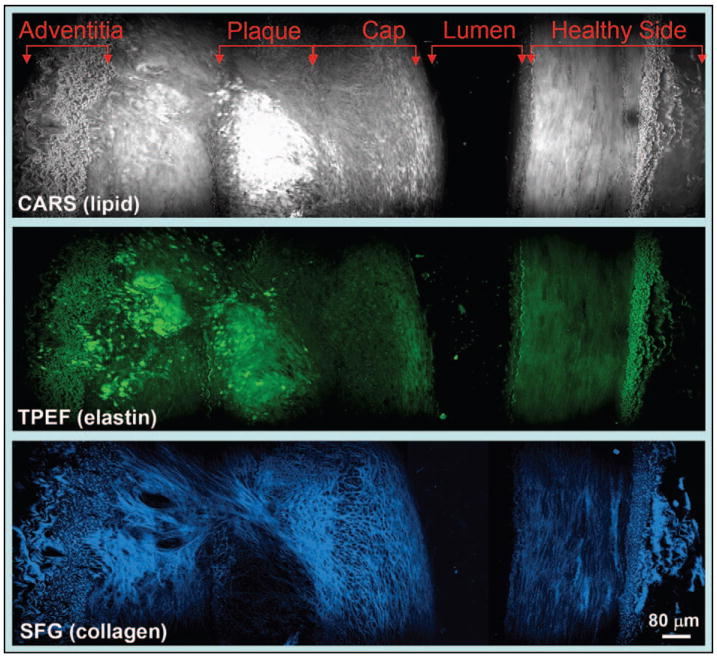
Cross-section view of an atherosclerotic plaque in an iliac artery imaged by (top) E-CARS, (middle) TPEF, and (bottom) SFG on the same platform. The plaque is enriched in lipids (grey) and elastin (green) but devoid of collagen fibrils (blue).
References
-
- Gannaway JN, Sheppard CJR. Opt Quant Electron. 1978;10:435.
-
- Hellwarth R, Christensen P. Opt Commun. 1974;12:318.
-
- Duncan MD, Reintjes J, Manuccia TJ. Opt Lett. 1982;7:350. - PubMed
-
- Denk W, Strickler JH, Webb WW. Science. 1990;248:73. - PubMed
-
- Barad Y, Eisenberg H, Horowitz M, Silberberg Y. Appl Phys Lett. 1997;70:922.
Publication types
MeSH terms
Grants and funding
LinkOut - more resources
Full Text Sources
Other Literature Sources
