. 2007 Oct 9;104(41):16164-9.
doi: 10.1073/pnas.0702896104. Epub 2007 Oct 2.

Modulation of LMP1 protein expression by EBV-encoded microRNAs

Affiliations

Modulation of LMP1 protein expression by EBV-encoded microRNAs

Angela Kwok Fung Lo et al. Proc Natl Acad Sci U S A. .

Abstract

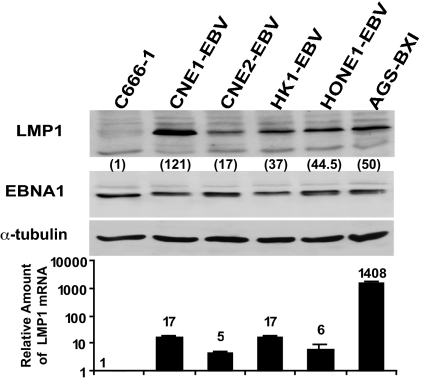
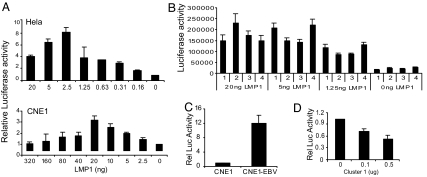
Epstein-Barr virus (EBV) was the first human virus found to encode microRNAs (miRNAs), but the function of these miRNAs has been obscure. Nasopharyngeal carcinoma (NPC) is associated with EBV infection, and the EBV-encoded LMP1 is believed to be a key factor in NPC development. However, detection of LMP1 protein in NPC is variable. Here, we report that EBV-encoded BART miRNAs target the 3' UTR of the LMP1 gene and negatively regulate LMP1 protein expression. These miRNAs also modulate LMP1-induced NF-kappaB signaling and alleviate the cisplatin sensitivity of LMP1-expressing NPC cells. Consistent with a previous study on the NPC C666-1 cell line and C15 xenograft, we found abundant expression of BART miRNAs in NPC tissues. Furthermore, DNA sequencing revealed that the 3' UTR of LMP1 is highly conserved in NPC-derived EBV isolates. The data provide insight into the discrepancy between LMP1 transcript and protein detection in NPC and highlight the role of the EBV miRNAs in regulating LMP1 downstream signaling to promote cancer development.


Conflict of interest statement

The authors declare no conflict of interest.

Figures

Fig. 1.
Fig. 1.
Expression of EBV miRNAs in infected epithelial cells. (A) Diagram showing the EBV miRNA locations. Latency II promoters and genes expressed in NPC are black. Other latency promoters and genes are gray. BHRF1 is a lytic gene, and its promoter and coding region are indicated by the white pennant and box. (B) Northern blotting of BART Cluster 1 miRNAs in B95.8 B cells and the EBV-infected epithelial cell lines (1), C666-1 (2), CNE1-EBV (3), HK1-EBV (4), and AGS-BXI (5). U6 snRNA was used as a loading control. (C) Northern blotting of BART1-5p and BART2 miRNAs in NPC biopsies. B95–8 (positive control).
Fig. 2.
Fig. 2.
BART Cluster 1 miRNAs target the LMP1 3′ UTR. (A) Schematic showing the location of predicted LMP1 target (tL) sites for BART 13-5p, 16, 17-5p, and 1-5p miRNAs. The LMP1 gene (open bar) is numbered according to GenBank accession no. X01995. Light shading, ORF. (B) Wild-type (wt) and mutant (mut) LMP1 3′ UTR target sequences of BART3-5p, 16, 17-5p, and 1-5p miRNAs that were cloned into luciferase reporters. (C) Luciferase activity of LMP1 target constructs in the presence of BART miRNAs. HeLa cells were transfected with luciferase reporters together with the indicated miRNA. The luciferase activity was normalized to β-gal activity. Fold change in luciferase activity of the wild-type LMP1 construct (black bars) was calculated relative to that of the mutated construct (white bars). Data shown are the mean ± SD from three separate experiments.
Fig. 3.
Fig. 3.
Comparison of LMP1 protein and mRNA expression in EBV-infected epithelial cells. (Upper) Western blotting of LMP1 protein in EBV-infected cells. Expression of EBNA1 and α-tubulin proteins formed internal controls. The relative LMP1 level was normalized to EBNA1. C666-1 was used as reference control and set at 1. (Lower) QRT-PCR of LMP1 mRNA in EBV-infected cells. Relative LMP1 level was normalized to EBNA1. C666-1 was set at 1.
Fig. 4.
Fig. 4.
Suppression of LMP1 protein expression by BART Cluster 1 miRNAs (A Upper) Western blotting of LMP1 and control EGFP in HeLa cells transfected with EGFP, LMP1, and Cluster 1 plasmids as indicated. LMP1 level was normalized to EGFP and was calculated relative to the vector control, which is set at 1. (Lower) LMP1 mRNA in the same samples assayed by QRT-PCR. LMP1 mRNA is normalized to EBNA1 and is shown relative to the vector control (set at 1). (B) HeLa cells were cotransfected with EGFP vector, LMP1 + 3′ UTR plasmid, and MABA-Cluster 1, Cluster 2 vector (Upper), BART1-5p, or BART2 synthetic miRNA (Lower). (C) The LMP1 expression vectors were transfected into HeLa cells together with the EGFP vector and miRNAs as indicated. (D Left) CNE1-EBV cells transfected with miRNAs as indicated. (Center) CNE1-EBV cells transfected with anti-miRNA oligos as indicated. (Right) AGS-BXI cells transfected with Cluster 1 vectors as indicated. EBNA1 and α-tubulin protein served as internal controls. LMP1 expression was normalized to EBNA1. (Lower) QRT-PCR of LMP1 mRNA in the same samples. LMP1 mRNA expression was normalized to EBNA1.
Fig. 5.
Fig. 5.
Cluster 1 miRNAs attenuate LMP1-induced cytotoxicity to cisplatin. (A) Colony-forming assay. CNE2 cells cotransfected with control vector, LMP1 alone, or plus the Cluster 1 expression vector were trypsinized and seeded into six-well plates. Cells were treated with cisplatin, and colonies consisting of >50 cells were scored on day 8. Data shown are the mean ± SD from three separate experiments. (B) Western blotting of PARP protein cleavage in CNE2 cells cotransfected with LMP1 together with pCMV4 or C666-1-Cluster 1 plasmid and treated with 0.5 μg/ml cisplatin. The relative PARP cleavage was calculated after normalizing to α-tubulin protein. The LMP1-null-transfected samples were set at 1. LMP1 and EGFP were included as internal controls. (C) CNE2 cells were transfected with LMP1 vector and either pCMV4 or C666-1-Cluster 1 constructs. Apoptotic cells were measured by TUNEL assay after 1 day of cisplatin treatment. Data shown are the mean ± SD from three experiments.
Fig. 6.
Fig. 6.
Modulation of LMP1-induced NF-κB activity by Cluster 1 miRNAs. (A) NF-κB luciferase reporter activity was measured in HeLa (Upper) or CNE1 (Lower) cells cotransfected with increasing amounts of LMP1 vector plus an SV40-β-gal control. Luciferase activity was normalized to β-gal activity and was plotted relative to that of reporter alone (set at 1). (B) HeLa cells were cotransfected with the NF-κB luciferase reporter, pCMV4 control (1), MABA-Cluster 1 (2), C666-1-Cluster 1 (3), or Cluster 2 vector (4) together with different amounts of LMP1 as indicated. Data represent the mean of normalized luciferase/β-gal activity ± SD from three independent experiments. (C) NF-κB activity was measured in CNE1 and CNE1-EBV cells transfected with an NFκB luciferase reporter vector. NF-κB activity is plotted relative to that in CNE1 cells (set at 1). (D) CNE1-EBV cells were cotransfected with the NF-κB luciferase reporter and the Cluster 1 miRNA plasmid. NF-κB activity is plotted relative to that of the reporter alone (set at 1).

References

    1. Rickinson AB, Kieff E. In: Fields Virology. Knipe DM, Howley PM, Griffin DE, editors. Philadelphia: Lippincott Williams & Wilkins; 2001. pp. 2575–2625.
    1. Raab-Traub N. Semin Cancer Biol. 2002;12:431–441. - PubMed
    1. Izumi KM, Kieff ED. Proc Natl Acad Sci USA. 1997;94:12592–12597. - PMC - PubMed
    1. Kieff E, Rickinson AB. In: Fields Virology. Knipe DM, Howley PM, Griffin DE, editors. Philadelphia: Lippincott Williams & Wilkins; 2001. pp. 2511–2573.
    1. Young LS, Murray PG. Oncogene. 2003;22:5108–5121. - PubMed

Publication types

MeSH terms

Associated data

LinkOut - more resources