

Effect of cellular quiescence on the success of targeted CML therapy
- PMID: 17912367
- PMCID: PMC1991595
- DOI: 10.1371/journal.pone.0000990
Effect of cellular quiescence on the success of targeted CML therapy
Abstract
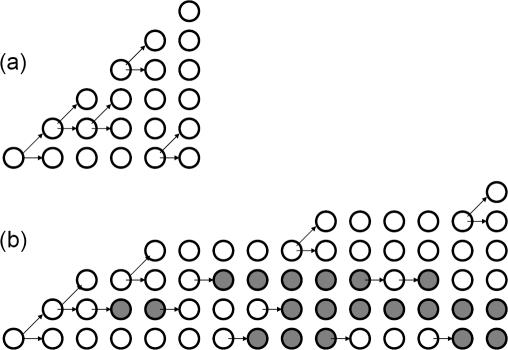
Background: Similar to tissue stem cells, primitive tumor cells in chronic myelogenous leukemia have been observed to undergo quiescence; that is, the cells can temporarily stop dividing. Using mathematical models, we investigate the effect of cellular quiescence on the outcome of therapy with targeted small molecule inhibitors.
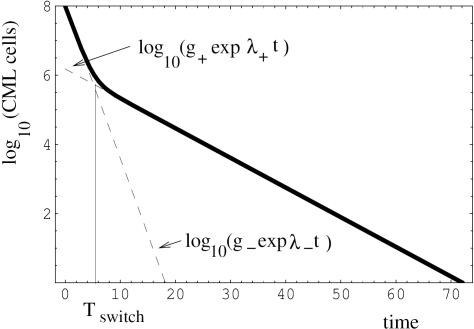
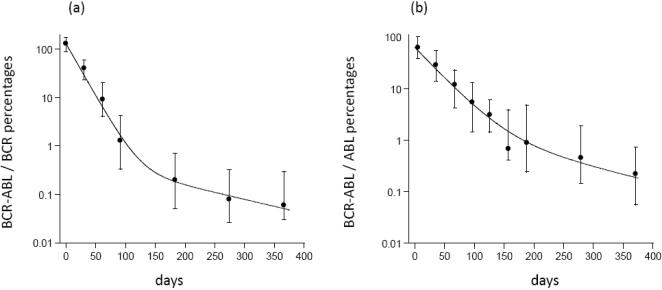
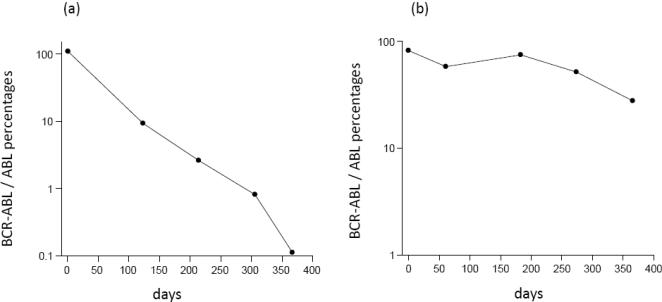
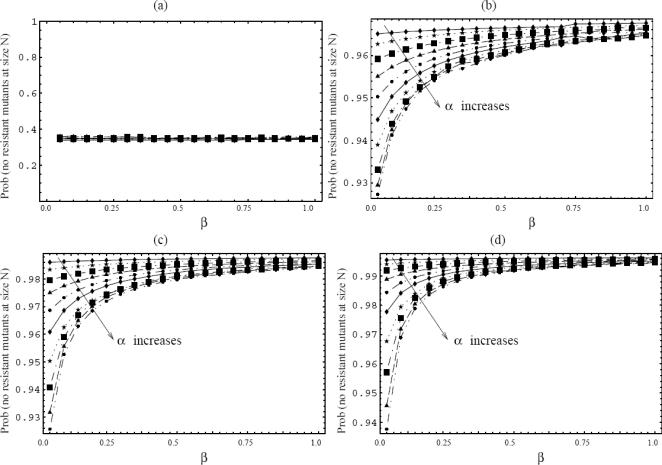
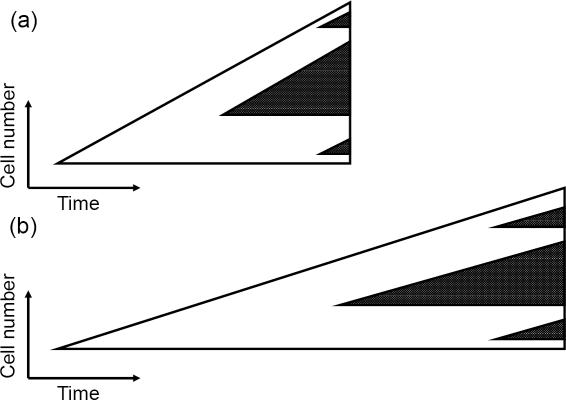
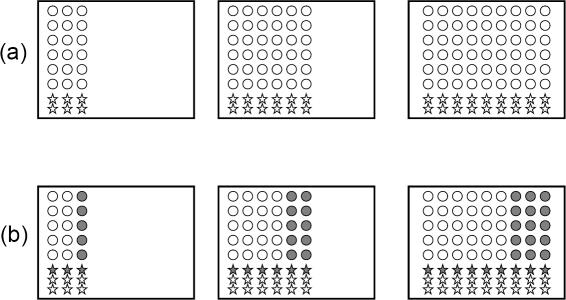
Methods and results: According to the models, the initiation of treatment can result in different patterns of tumor cell decline: a biphasic decline, a one-phase decline, and a reverse biphasic decline. A biphasic decline involves a fast initial phase (which roughly corresponds to the eradication of cycling cells by the drug), followed by a second and slower phase of exponential decline (corresponding to awakening and death of quiescent cells), which helps explain clinical data. We define the time when the switch to the second phase occurs, and identify parameters that determine whether therapy can drive the tumor extinct in a reasonable period of time or not. We further ask how cellular quiescence affects the evolution of drug resistance. We find that it has no effect on the probability that resistant mutants exist before therapy if treatment occurs with a single drug, but that quiescence increases the probability of having resistant mutants if patients are treated with a combination of two or more drugs with different targets. Interestingly, while quiescence prolongs the time until therapy reduces the number of cells to low levels or extinction, the therapy phase is irrelevant for the evolution of drug resistant mutants. If treatment fails as a result of resistance, the mutants will have evolved during the tumor growth phase, before the start of therapy. Thus, prevention of resistance is not promoted by reducing the quiescent cell population during therapy (e.g., by a combination of cell activation and drug-mediated killing).
Conclusions: The mathematical models provide insights into the effect of quiescence on the basic kinetics of the response to targeted treatment of CML. They identify determinants of success in the absence of drug resistant mutants, and elucidate how quiescence influences the emergence of drug resistant mutants.
Conflict of interest statement
Figures
Similar articles
-
Targeted chronic myeloid leukemia therapy: Seeking a cure.Am J Health Syst Pharm. 2007 Dec 15;64(24 Suppl 15):S9-15. doi: 10.2146/ajhp070482. Am J Health Syst Pharm. 2007. PMID: 18056932 Review.
-
Targeted chronic myeloid leukemia therapy: seeking a cure.J Manag Care Pharm. 2007 Oct;13(8 Suppl A):8-12. doi: 10.18553/jmcp.2007.13.s8-a.8. J Manag Care Pharm. 2007. PMID: 17970609 Free PMC article. Review.
-
Use of dasatinib and nilotinib in imatinib-resistant chronic myeloid leukemia: translating preclinical findings to clinical practice.Leuk Lymphoma. 2010 Mar;51(3):363-75. doi: 10.3109/10428190903518295. Leuk Lymphoma. 2010. PMID: 20038231 Review.
-
New strategies in controlling drug resistance.J Manag Care Pharm. 2007 Oct;13(8 Suppl A):13-7. doi: 10.18553/jmcp.2007.13.s8-a.13. J Manag Care Pharm. 2007. PMID: 17970610 Free PMC article. Review.
-
PD166326, a novel tyrosine kinase inhibitor, has greater antileukemic activity than imatinib mesylate in a murine model of chronic myeloid leukemia.Blood. 2005 May 15;105(10):3995-4003. doi: 10.1182/blood-2004-09-3534. Epub 2005 Jan 18. Blood. 2005. PMID: 15657179 Free PMC article.
Cited by
-
Tyrosine kinase inhibitors and mesenchymal stromal cells: effects on self-renewal, commitment and functions.Oncotarget. 2017 Jan 17;8(3):5540-5565. doi: 10.18632/oncotarget.12649. Oncotarget. 2017. PMID: 27750212 Free PMC article. Review.
-
Early dynamics of chronic myeloid leukemia on nilotinib predicts deep molecular response.NPJ Syst Biol Appl. 2022 Oct 13;8(1):39. doi: 10.1038/s41540-022-00248-3. NPJ Syst Biol Appl. 2022. PMID: 36229495 Free PMC article.
-
Selection pressure exerted by imatinib therapy leads to disparate outcomes of imatinib discontinuation trials.Haematologica. 2012 Oct;97(10):1553-61. doi: 10.3324/haematol.2012.062844. Epub 2012 Mar 14. Haematologica. 2012. PMID: 22419579 Free PMC article.
-
Eradication of chronic myeloid leukemia stem cells: a novel mathematical model predicts no therapeutic benefit of adding G-CSF to imatinib.PLoS Comput Biol. 2009 Sep;5(9):e1000503. doi: 10.1371/journal.pcbi.1000503. Epub 2009 Sep 11. PLoS Comput Biol. 2009. PMID: 19749982 Free PMC article.
-
A Review of Mathematical Models for Tumor Dynamics and Treatment Resistance Evolution of Solid Tumors.CPT Pharmacometrics Syst Pharmacol. 2019 Oct;8(10):720-737. doi: 10.1002/psp4.12450. Epub 2019 Aug 9. CPT Pharmacometrics Syst Pharmacol. 2019. PMID: 31250989 Free PMC article. Review.
References
-
- Arai F, Suda T. Maintenance of quiescent hematopoietic stem cells in the osteoblastic niche. Ann N Y Acad Sci 2007 - PubMed
-
- Moore KA, Lemischka IR. Stem cells and their niches. Science. 2006;311:1880–1885. - PubMed
-
- Fuchs E, Tumbar T, Guasch G. Socializing with the neighbors: stem cells and their niche. Cell. 2004;116:769–778. - PubMed
Publication types
MeSH terms
Substances
Grants and funding
LinkOut - more resources
Full Text Sources
Other Literature Sources
Medical
