

Lead-induced alterations of apoptosis and neurotrophic factor mRNA in the developing rat cortex, hippocampus, and cerebellum
- PMID: 17912701
- PMCID: PMC2366037
- DOI: 10.1002/jbt.20191
Lead-induced alterations of apoptosis and neurotrophic factor mRNA in the developing rat cortex, hippocampus, and cerebellum
Abstract
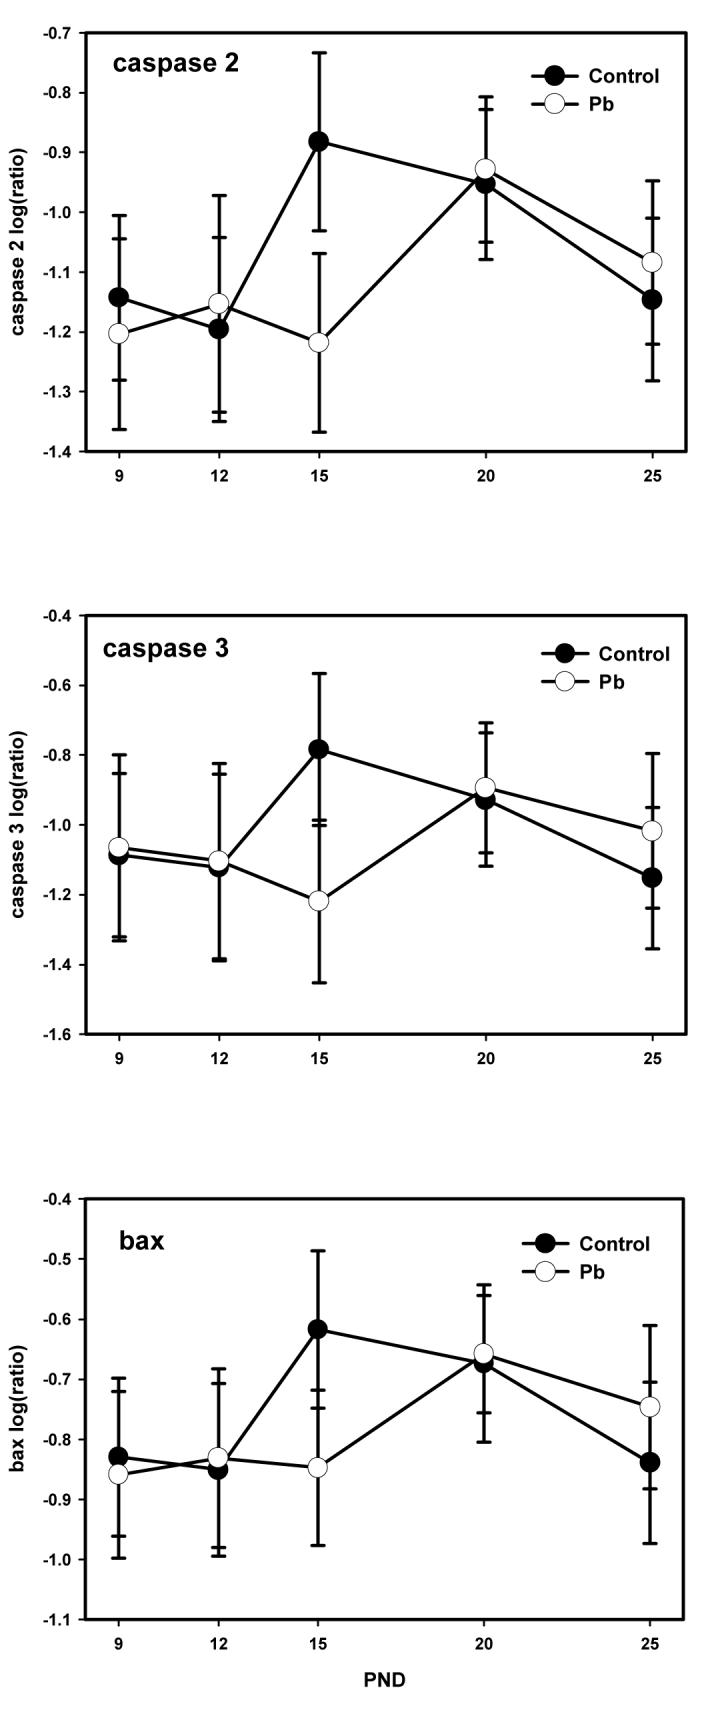
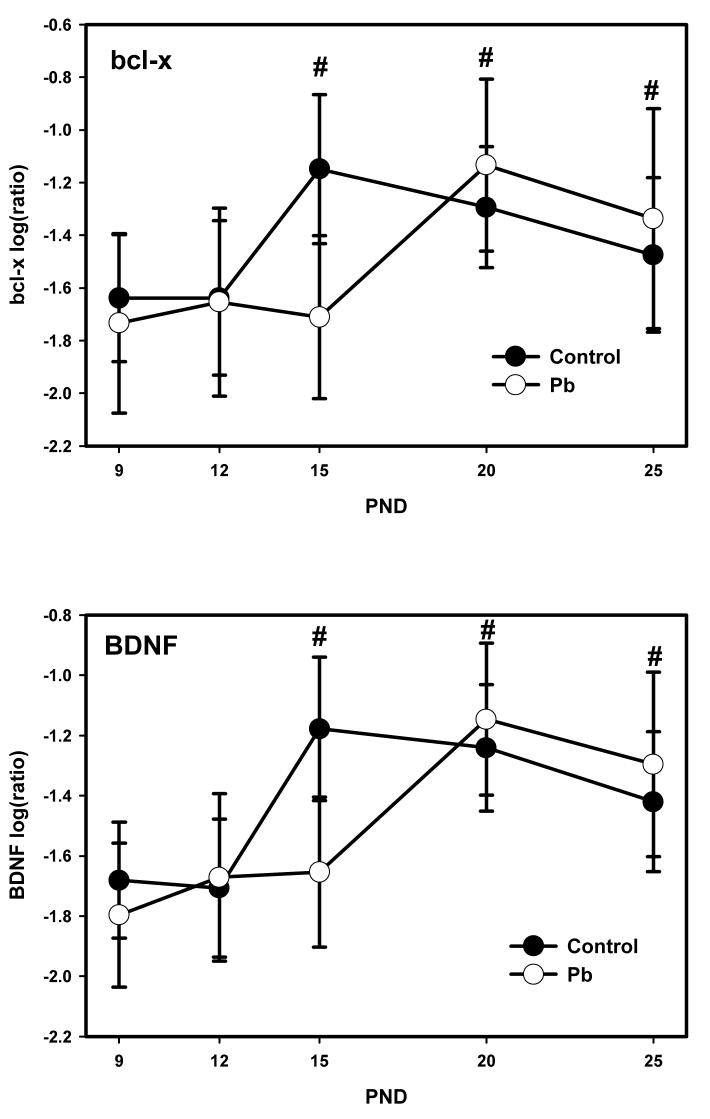
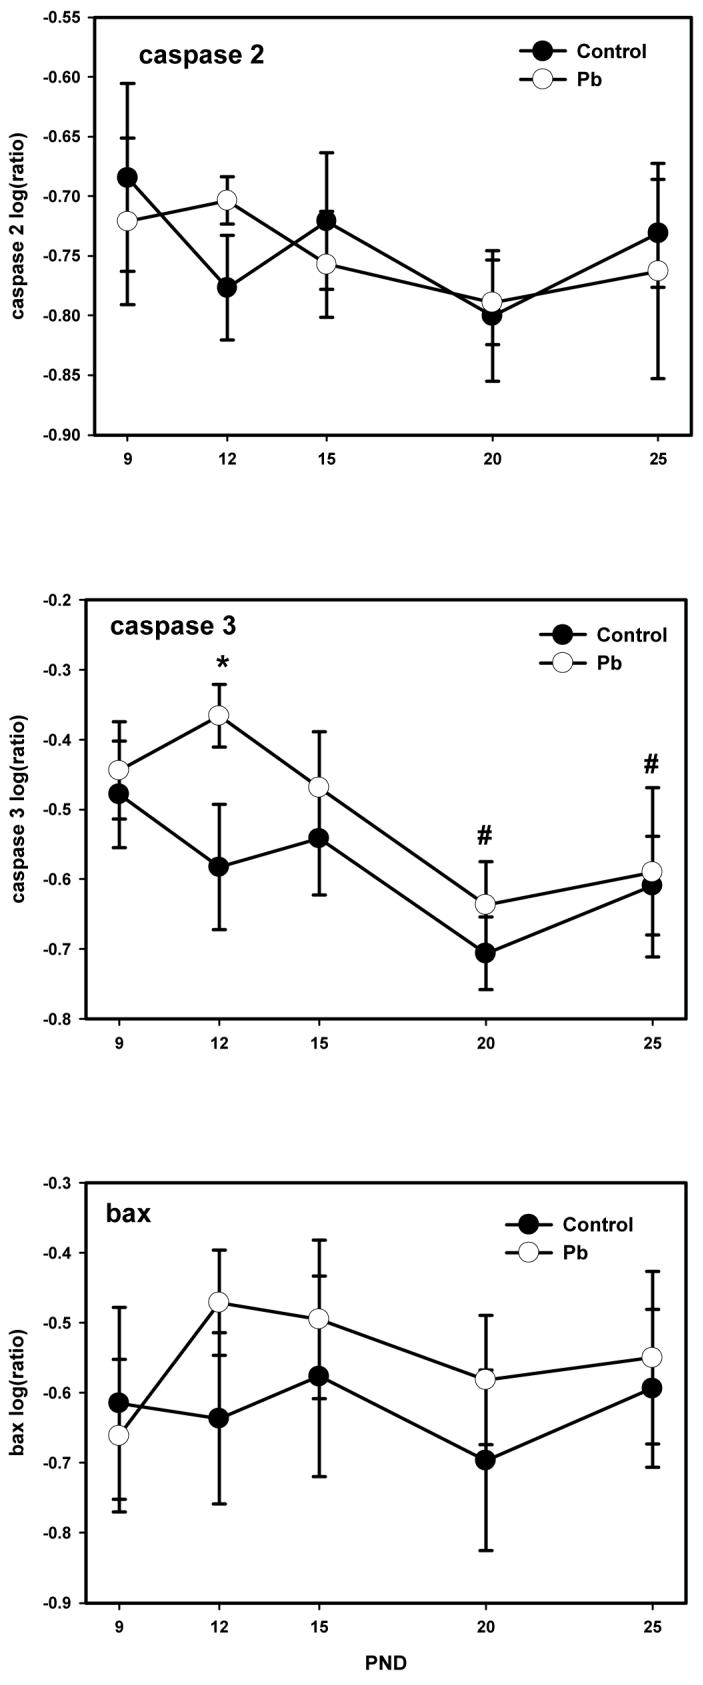
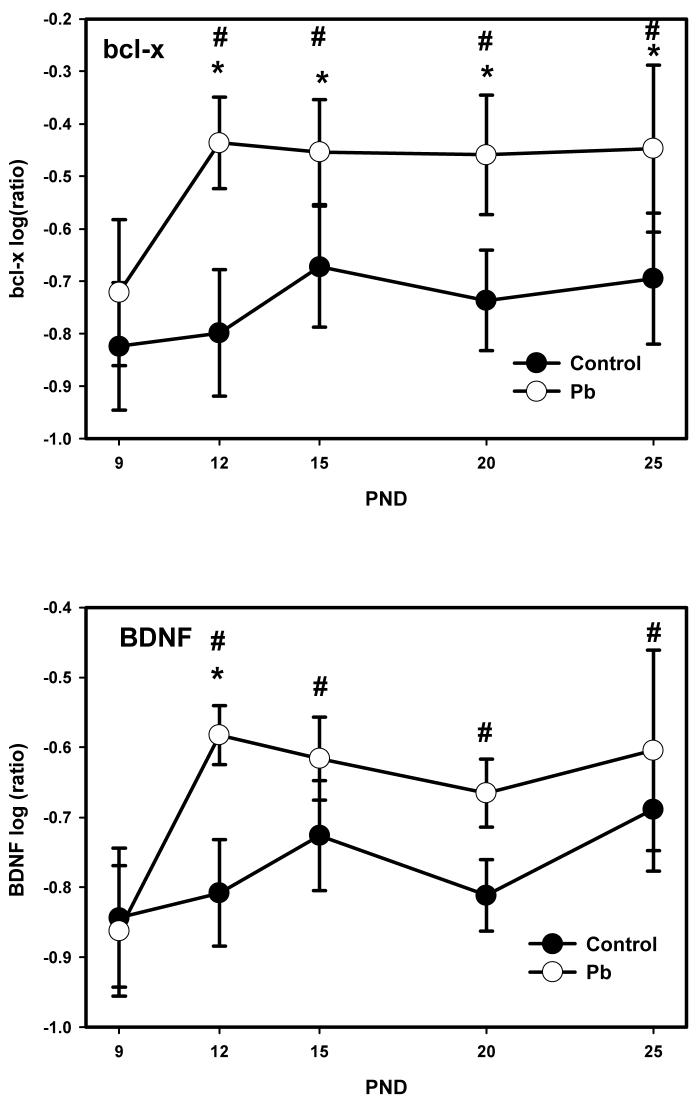
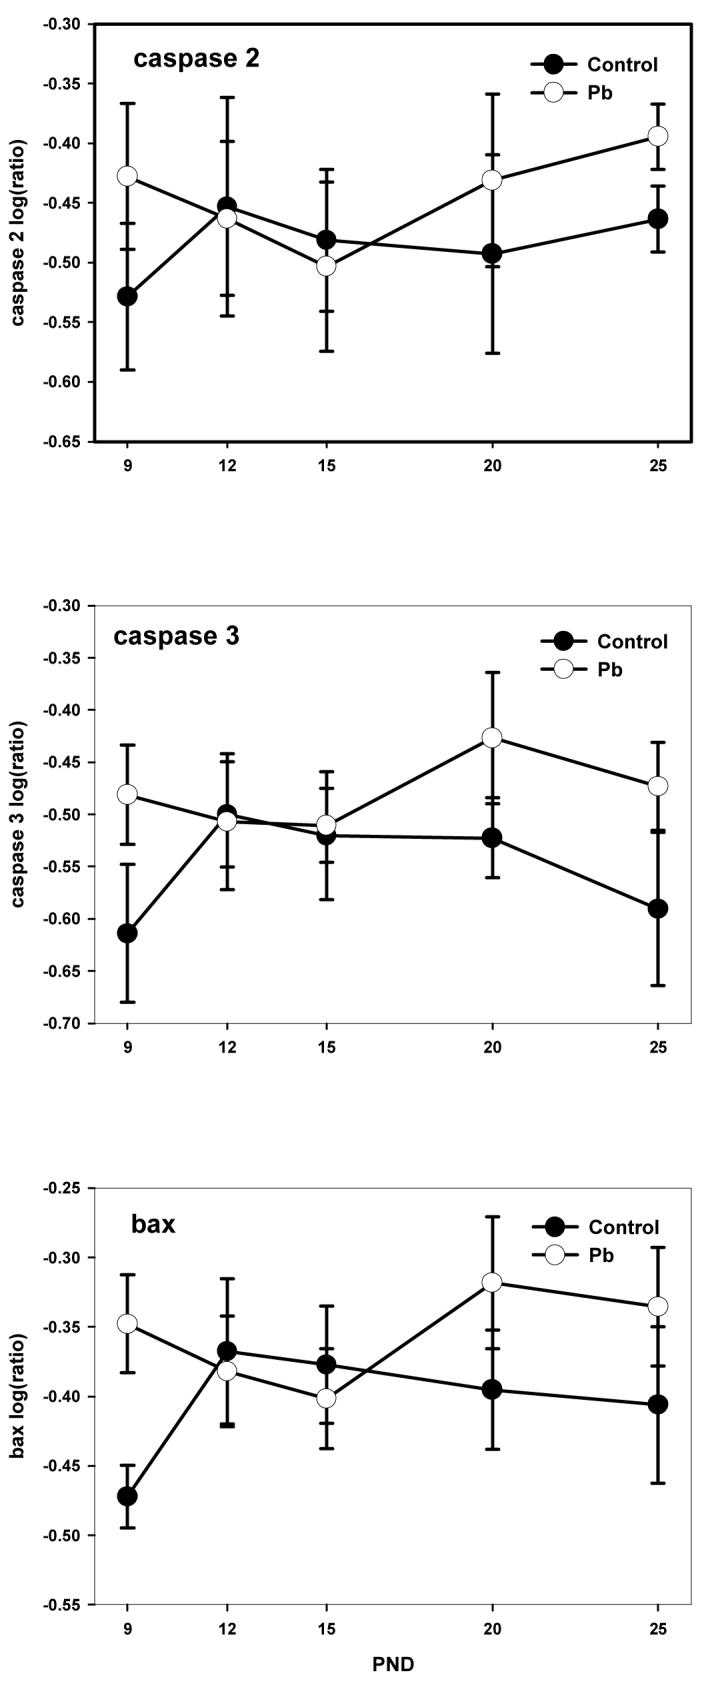
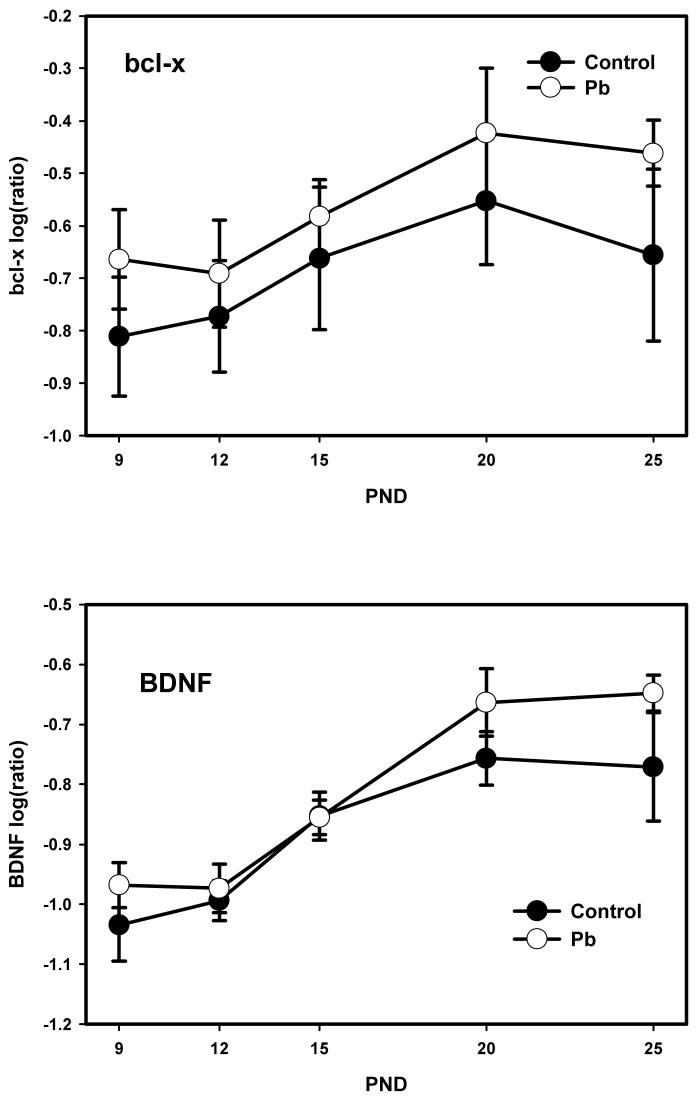
Previous reports have recently shown the prototypic neurotoxicant, lead, to induce apoptosis in the brains of developing organisms. In the current study, timed-pregnant rats were exposed to lead acetate (0.2% in the drinking water) 24 h following birth at postnatal day 1 (PND 1). Dams and pups were continuously exposed to lead through the drinking water of the dam until PND 20. Postnatal exposure in the pups resulted in altered mRNA levels of the following apoptotic and neurotrophic factors: caspase 2 and 3, bax, bcl-x, brain-derived neurotrophic factor (BDNF). Ribonuclease protection assays were conducted to measure the factors simultaneously at the following postnatal time points: 9, 12, 15, 20, 25, days. Our results suggest a brain region- and time-specific response following lead acetate exposure. The region most vulnerable to alterations occurs in the hippocampus with alterations beginning at PND 12, in which caspase 3, bcl-x, BDNF increase with lead exposure. Significant treatment effects were not observed for both the cortex and cerebellum.
(c) 2007 Wiley Periodicals, Inc.
Figures
Similar articles
-
Lead-induced alterations of glial fibrillary acidic protein (GFAP) in the developing rat brain.Toxicol Appl Pharmacol. 1996 Jul;139(1):84-93. doi: 10.1006/taap.1996.0145. Toxicol Appl Pharmacol. 1996. PMID: 8685912
-
Perinatal exposure to lead induces morphological, ultrastructural and molecular alterations in the hippocampus.Toxicology. 2013 Jan 7;303:187-200. doi: 10.1016/j.tox.2012.10.027. Epub 2012 Nov 9. Toxicology. 2013. PMID: 23146751
-
Lead induced effects on acetylcholinesterase activity in cerebellum and hippocampus of developing rat.Int J Dev Neurosci. 2003 Oct;21(6):347-52. doi: 10.1016/s0736-5748(03)00071-6. Int J Dev Neurosci. 2003. PMID: 12927583
-
[Effects of ligands of alpha2-adrenoceptors on mRNA level of apoptotic proteins in the developing rat brain].Izv Akad Nauk Ser Biol. 2008 Jan-Feb;(1):104-9. Izv Akad Nauk Ser Biol. 2008. PMID: 18491567 Russian.
-
Effects of cadmium on Bcl-2/ Bax expression ratio in rat cortex brain and hippocampus.Hum Exp Toxicol. 2018 Mar;37(3):321-328. doi: 10.1177/0960327117703687. Epub 2017 Apr 17. Hum Exp Toxicol. 2018. PMID: 28413886
Cited by
-
The Neuroprotective Role of Coenzyme Q10 Against Lead Acetate-Induced Neurotoxicity Is Mediated by Antioxidant, Anti-Inflammatory and Anti-Apoptotic Activities.Int J Environ Res Public Health. 2019 Aug 13;16(16):2895. doi: 10.3390/ijerph16162895. Int J Environ Res Public Health. 2019. PMID: 31412628 Free PMC article.
-
Development of the Adverse Outcome Pathway (AOP): Chronic binding of antagonist to N-methyl-d-aspartate receptors (NMDARs) during brain development induces impairment of learning and memory abilities of children.Toxicol Appl Pharmacol. 2018 Sep 1;354:153-175. doi: 10.1016/j.taap.2018.02.024. Epub 2018 Mar 7. Toxicol Appl Pharmacol. 2018. PMID: 29524501 Free PMC article.
-
Aberrant cerebellar neurotrophin-3 expression induced by lipopolysaccharide exposure during brain development.Cerebellum. 2013 Jun;12(3):316-8. doi: 10.1007/s12311-012-0446-7. Cerebellum. 2013. PMID: 23319369
-
Neuroprotective effects of PACAP against ethanol-induced toxicity in the developing rat cerebellum.Neurotox Res. 2011 Apr;19(3):423-34. doi: 10.1007/s12640-010-9186-y. Epub 2010 Apr 27. Neurotox Res. 2011. PMID: 20422475
-
Effect of chronic lead exposure on pro-apoptotic Bax and anti-apoptotic Bcl-2 protein expression in rat hippocampus in vivo.Cell Mol Neurobiol. 2010 Jul;30(5):769-74. doi: 10.1007/s10571-010-9504-1. Epub 2010 Feb 11. Cell Mol Neurobiol. 2010. PMID: 20148304 Free PMC article.
References
-
- Petit TL, Alfano DP, LeBoutillier JC. Early lead exposure and the hippocampus: a review and recent advances. Neurotoxicology. 1983;4:79–94. - PubMed
-
- Shellenberger MK. Effects of early lead exposure on neurotransmitter systems in the brain. A review with commentary. Neurotoxicology. 1984;5:177–212. - PubMed
-
- Lanphear BP, Hornung R, Ho M, Howard CR, Eberly S, Knauf K. Environmental lead exposure during early childhood. J Pediatr. 2002;140:40–7. - PubMed
-
- Petit TL, LeBoutillier JC. Effects of lead exposure during development on neocortical dendritic and synaptic structure. Exp Neurol. 1979;64:482–492. - PubMed
Publication types
MeSH terms
Substances
Grants and funding
LinkOut - more resources
Full Text Sources
Molecular Biology Databases
Research Materials
