. 2007 Dec;81(24):13299-314.
doi: 10.1128/JVI.00732-07. Epub 2007 Oct 3.

Promoter- and cell-specific transcriptional transactivation by the Kaposi's sarcoma-associated herpesvirus ORF57/Mta protein

Affiliations

Promoter- and cell-specific transcriptional transactivation by the Kaposi's sarcoma-associated herpesvirus ORF57/Mta protein

Diana Palmeri et al. J Virol. 2007 Dec.

Abstract

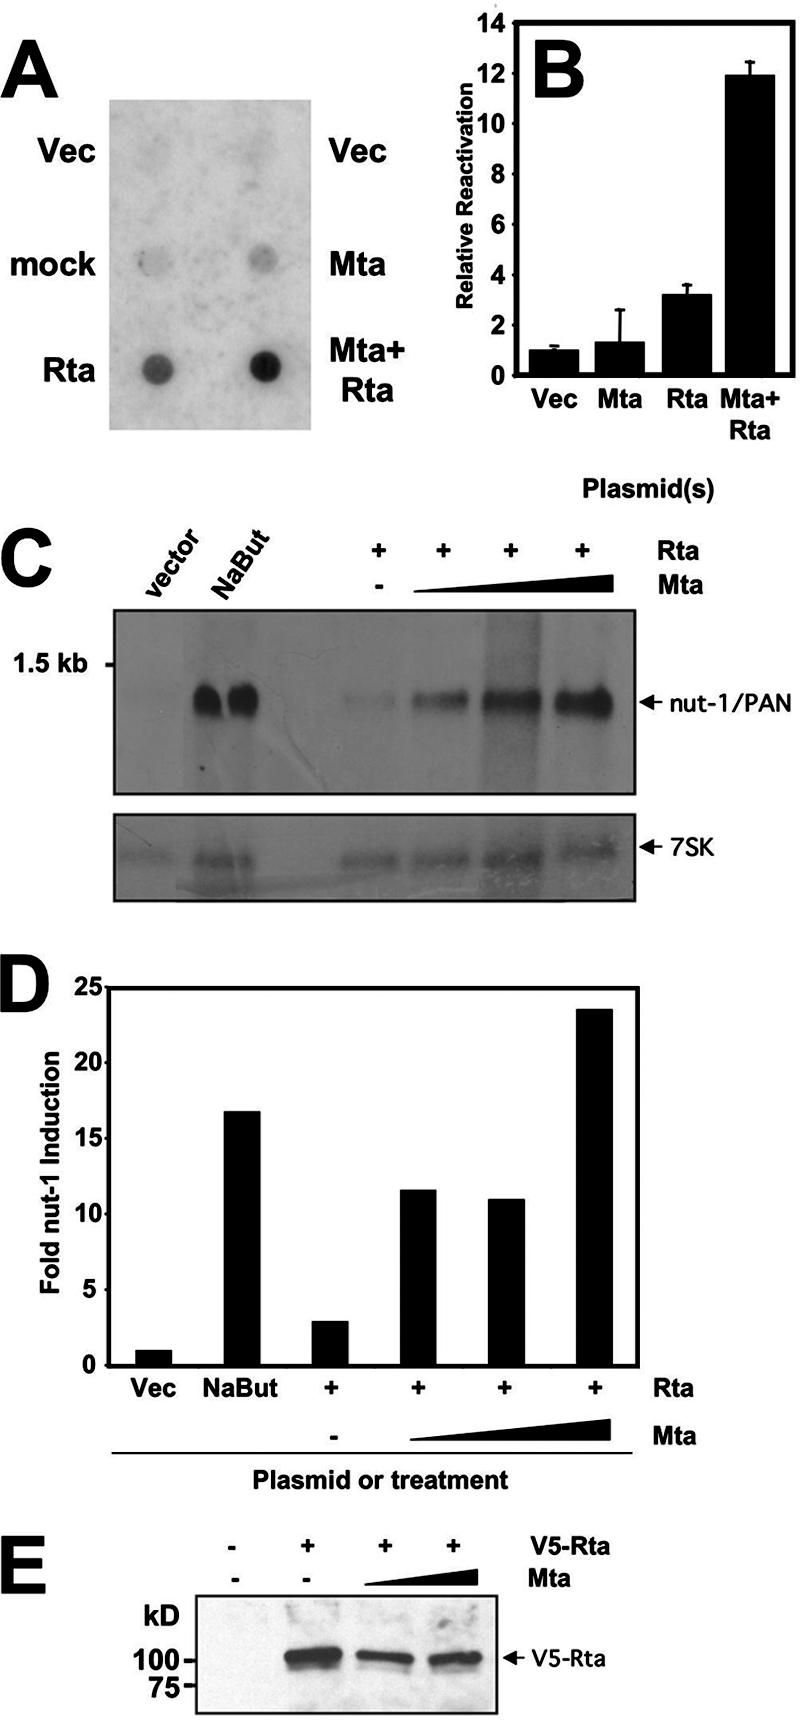
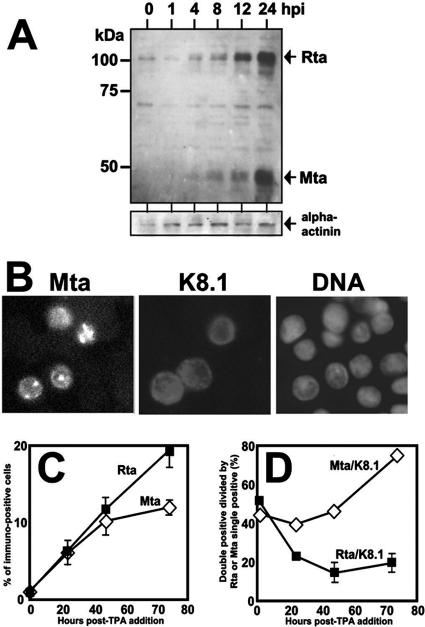
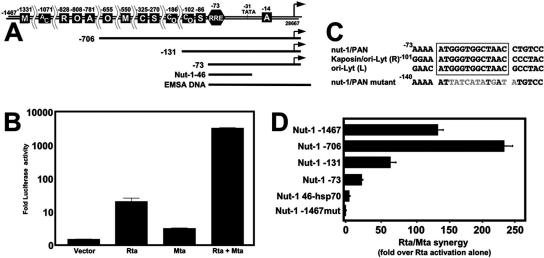
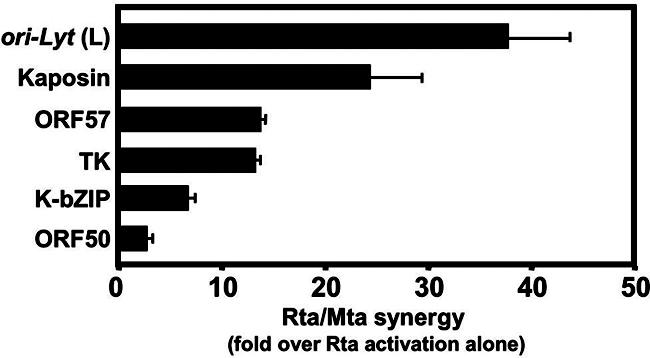
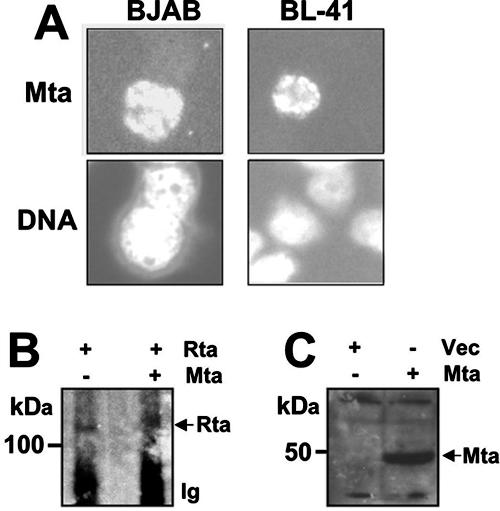
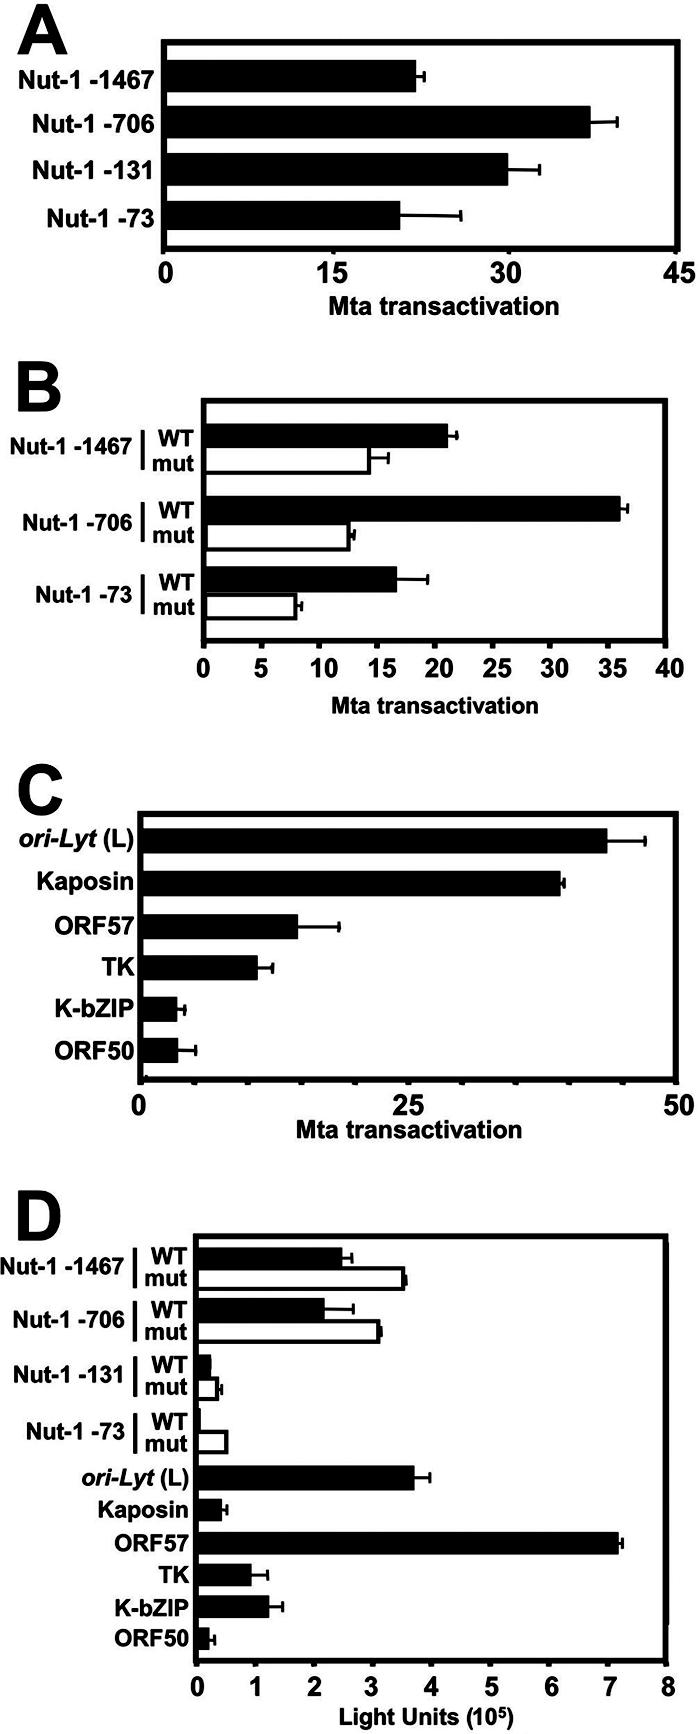
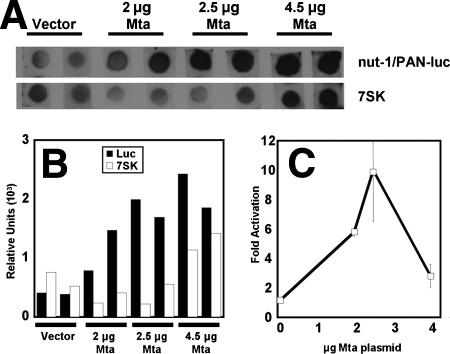
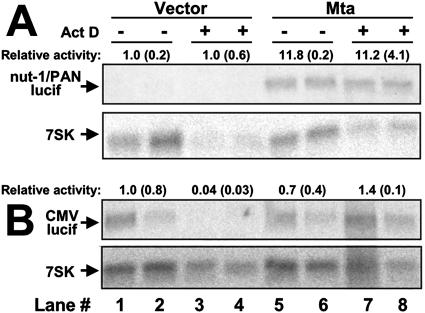
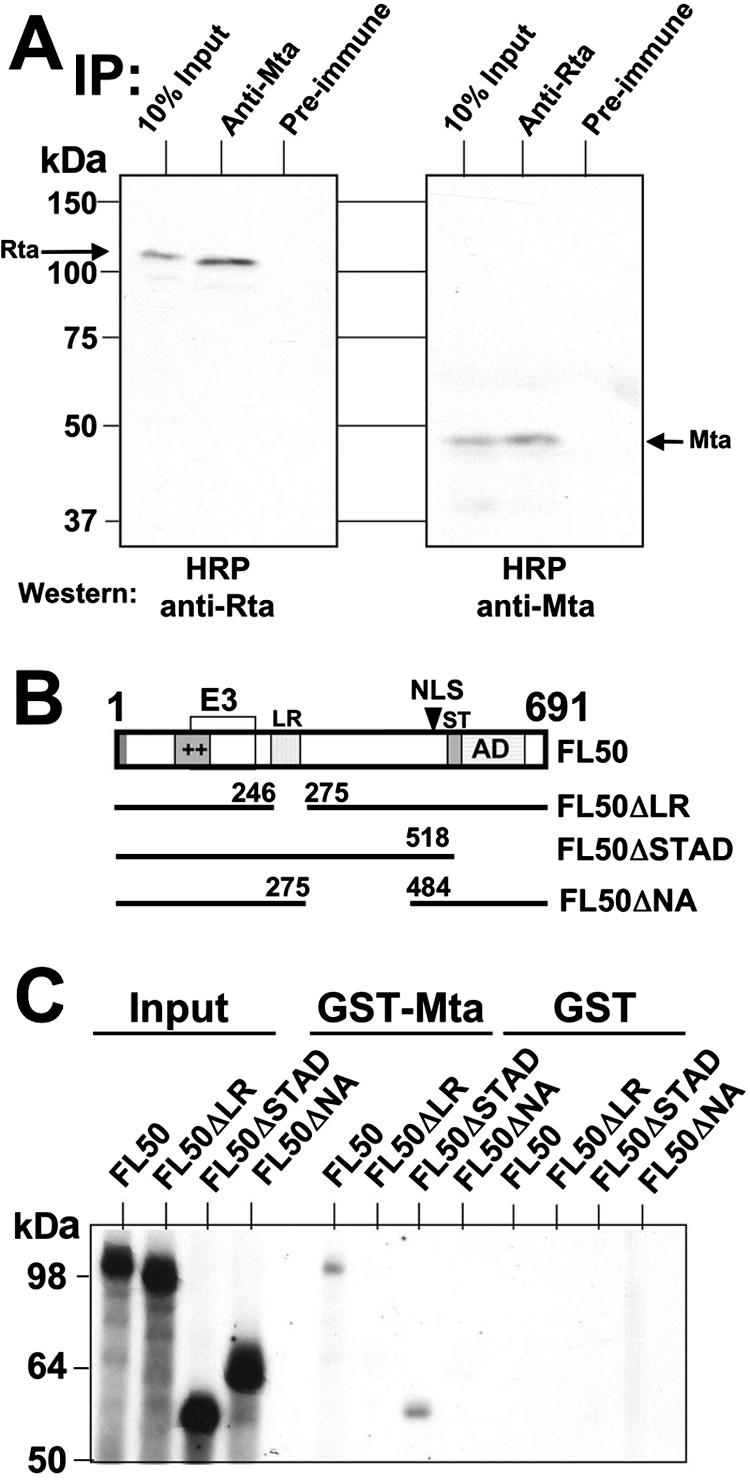
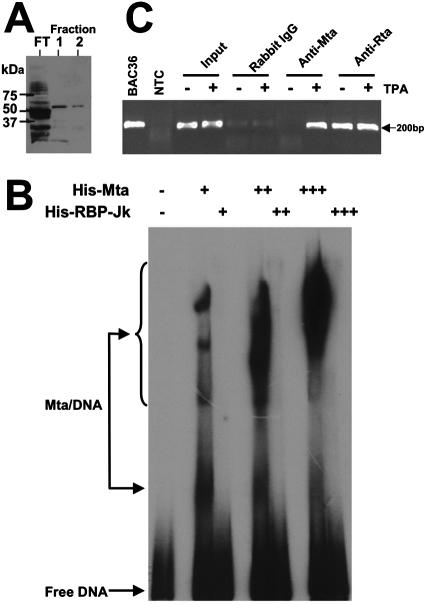
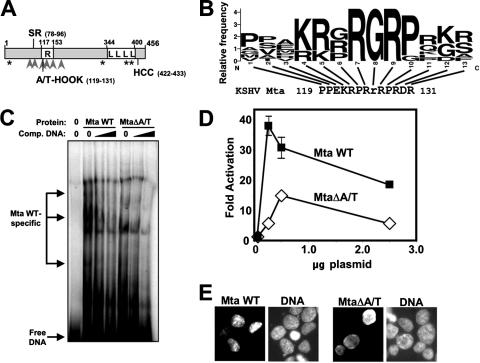
The Kaposi's sarcoma-associated herpesvirus (KSHV) Mta protein, encoded by open reading frame 57, is a transactivator of gene expression that is essential for productive viral replication. Previous studies have suggested both transcriptional and posttranscriptional roles for Mta, but little is known regarding Mta's transcriptional function. In this study, we demonstrate that Mta cooperates with the KSHV lytic switch protein, Rta, to reactivate KSHV from latency, but Mta has little effect on reactivation when expressed alone. We demonstrate that the Mta and Rta proteins are expressed with similar but distinct kinetics during KSHV reactivation. In single-cell analyses, Mta expression coincides tightly with progression to full viral reactivation. We demonstrate with promoter reporter assays that while Rta activates transcription in all cell lines tested, Mta's ability to transactivate promoters, either alone or synergistically with Rta, is cell and promoter specific. In particular, Mta robustly transactivates the nut-1/PAN promoter independently of Rta in 293 and Akata-31 cells. Using nuclear run-on assays, we demonstrate that Mta stimulates transcriptional initiation in 293 cells. Rta and Mta physically interact in infected cell extracts, and this interaction requires the intact leucine repeat and central region of Rta in vitro. We demonstrate that Mta also binds to the nut-1/PAN promoter DNA in vitro and in infected cells. An Mta mutant with a lesion in a putative A/T hook domain is altered in DNA binding and debilitated in transactivation. We propose that one molecular mechanism of Mta-mediated transactivation is a direct effect on transcription by direct and indirect promoter association.


Figures

FIG. 1.
FIG. 1.
Mta cooperates with Rta to reactivate KSHV from latency. (A) Virion production. HH-B2 (PEL) cells were electroporated with the indicated plasmids or without DNA (mock). Virion-associated DNA was purified 6 days postelectroporation, dot-blotted, and probed with 32P-labeled ORF6 DNA. Signal was detected by autoradiography. Vec, pcDNA3 plasmid. (B) Late protein production in single cells. BCBL-1 (PEL) cells were electroporated in duplicate with the indicated plasmids; 48 h postelectroporation, the cells were analyzed by indirect immunofluorescence to detect expression of the KSHV proteins ORF50/Rta and K8.1. At least 500 cells were quantitated manually by fluorescence microscopy. The percentage of Rta-positive cells that were also K8.1 positive was determined for each transfection; the value calculated for vector-transfected cells (Vec; pcDNA3, i.e., spontaneously reactivating cells) was subtracted from each of the others, and the resulting difference is graphed. The error bars indicate standard deviations. (C and D) Delayed early transcript production. HH-B2 cells were electroporated with the indicated plasmids or treated with sodium butyrate (NaBut), and total RNA was purified 24 h postelectroporation. RNA was analyzed by Northern blotting, sequentially probing for nut-1/PAN or 7SK transcripts. Signals were quantitated by phosphorimager; nut-1/PAN signals were normalized to 7SK signals and are graphed in panel D. (E) Mta does not stimulate Rta expression from a plasmid in infected cells. BCBL-1 cells were electroporated with expression plasmids for V5-Rta (10 μg) and Mta (2.5 or 10 μg), alone or together. Proteins immunoprecipitated by the V5-specific antiserum were analyzed by Western blotting using the V5 antiserum as the primary probe.
FIG. 2.
FIG. 2.
ORF57/Mta expression is tightly linked to K8.1 expression at the single-cell level. (A) Kinetics of ORF50/Rta and ORF57/Mta protein expression are similar but distinct. BCBL-1 (PEL) cells were treated with TPA or left untreated (0), and total protein was harvested at the indicated times after TPA addition (hpi, hours postinduction). Equivalent amounts of total protein for each time point (as determined by Bradford assay) were displayed by SDS-PAGE and then transferred to nitrocellulose. The membrane was analyzed by immunoblotting it sequentially with the indicated primary antibodies. Alpha-actinin served as a loading control. (B) ORF57/Mta is expressed in the nucleus in reactivating PEL cells. BCBL-1 (PEL) cells were treated with TPA for 24 h and then analyzed by indirect immunofluorescence using primary antibodies specific for Mta or K8.1 and secondary antibodies conjugated to FITC or TRITC, respectively. DNA was stained with DAPI for visualization of nuclei. Fluorescent signals were digitally converted to grayscale. (C) The percentage of reactivating cells detected by Rta or Mta expression increases with kinetically distinct patterns during reactivation. BCBL-1 (PEL) cells were analyzed as in panel B using primary antibodies specific for Rta or Mta in parallel cultures and secondary antibody conjugated to FITC. The percentage of total cells expressing either Rta or Mta was quantitated at the indicated times post-TPA addition. The error bars indicate standard deviations. (D) ORF57/Mta expression is tightly linked to K8.1 expression at the single-cell level. The cells shown in panel C were simultaneously analyzed by immunofluorescence using primary antibody specific for K8.1 and secondary antibody conjugated to TRITC. The number of Mta/K8.1 double-positive cells was divided by the number of Mta single-positive cells and plotted. The calculation and plot were computed for Rta and K8.1 identically.
FIG. 3.
FIG. 3.
Mta and Rta synergize to transactivate the nut-1/PAN promoter in a sequence-specific fashion. (A) Schematic of the nut-1/PAN promoter. The double line at the top shows the nut-1/PAN promoter, extending to position −1467 from the transcriptional start site, which was cloned into the firefly luciferase reporter vector. The lines below the promoter represent the deletion mutants of the promoter cloned similarly. Nut-1-46 is the 46-bp region cloned into the heterologous reporter plasmid hsp-luc. EMSA DNA represents the double-stranded DNA used in the EMSA shown in Fig. 10B. The boxed letters along the promoter schematic represent relative locations of consensus cellular protein binding sites as determined by searching TransFac (105) at high stringency or published previously (48, 100). M, c-myc; A, AP-1; C, CAAT box; R, RBP-Jk; O, Oct-1; S, Sp1. (B) ORF50/Rta and ORF57/Mta synergize to transactivate the nut-1/PAN promoter. CV-1 cells were cotransfected with pGL3-nut1 (−1467) and empty pcDNA3 vector (Vector) or increasing amounts of pcDNA3.1-FLg50 plasmid (0 to 4 μg) to determine the amount of ORF50 plasmid that yielded the greatest magnitude of transactivation relative to empty vector. The experiment was then repeated using increasing amounts of pcDNA3.1-ORF57 Hygro alone (0 to 3 μg) or together with the optimal amount of pcDNA3.1-FLg50 (0.5 μg). The maximal amounts of transactivation for each condition are plotted; the error bars indicate standard deviations. pcDNA3.1-His-lacZ was cotransfected in all experiments to normalize transfection efficiency by determination of β-galactosidase activity. (C) Alignment of RREs from KSHV promoters. RREs from the indicated promoters were aligned with the mutant RRE analyzed in panel D and Fig. 6. (D) The RRE is necessary but not sufficient for Mta-Rta synergy. The experiments shown in panel B were repeated with each of the nut-1/PAN reporter vectors shown. The maximal amount of synergy of cotransfected Mta and Rta expression plasmids was divided by the amount of transactivation by Rta alone and graphed.
FIG. 4.
FIG. 4.
Mta and Rta synergize in a promoter-specific fashion. Each of the indicated reporter plasmids was analyzed in transfections of CV-1 cells as in Fig. 3D. The maximal amount of synergy of cotransfected Mta and Rta expression plasmids was divided by the amount of transactivation by Rta alone and graphed. The error bars indicate standard deviations.
FIG. 5.
FIG. 5.
Mta is expressed in BJAB, BL-41, and 293 cells and does not stimulate expression of Rta from a plasmid in uninfected cells. (A) Mta is expressed in the nuclei of BJAB and BL-41 cells. BJAB and BL-41 cells were electroporated with 5 μg of the Mta expression vector, and immunofluorescence was determined as described in the legend to Fig. 2B. (B) Mta does not stimulate expression of Rta from a plasmid in uninfected cells. BL-41 cells were transfected with 5 μg each of expression plasmids for Rta and Mta, alone or together. Proteins immunoprecipitated by the Rta-specific antiserum were analyzed by Western blotting using the Rta antiserum as the primary probe. (C) Mta is expressed in 293 cells. 293 cells were transfected with 3.5 μg of the Mta expression vector or empty expression vector (Vec). Equal amounts of protein were separated by SDS-PAGE and analyzed by Western blotting using the anti-Mta serum.
FIG. 6.
FIG. 6.
Mta transactivation is promoter specific. (A) Mta transactivation of the nut-1/PAN promoter deletions mirrors Mta-Rta synergy. 293 cells were cotransfected with the indicated reporter vectors and empty pcDNA3 vector or increasing amounts of pcDNA3-FLc57 plasmid. The greatest magnitude of transactivation by ORF57 relative to empty vector is graphed. The error bars indicate standard deviations. (B) Mutation of the RRE reduces but does not eliminate Mta transactivation of the nut-1/PAN promoter. Each of the indicated reporter vectors was tested for Mta transactivation in transfected 293 cells as described for panel A. (C) Promoter-specific transactivation by Mta mirrors promoter-specific synergy by Mta/Rta. Each of the indicated reporter vectors was tested for Mta transactivation in transfected 293 cells as described for panel A. (D) Promoter-specific Mta transactivation is independent of basal promoter activity. Shown are average light units of intrinsic luciferase activity for each of the indicated reporter vectors cotransfected with the empty pcDNA3 vector in 293 cells in the experiments shown in Fig. 6A, B, and C. mut, mutant.
FIG. 7.
FIG. 7.
ORF57/Mta is a transcriptional transactivator. 293 cells were cotransfected with the pGL3-nut-1/PAN (−1467) plasmid and the empty vector pcDNA3 (Vector) or the indicated amounts of pcDNA3-FLc57 plasmid. Total nuclei were isolated from each transfected-cell population and analyzed by run-on transcription assays as described in Materials and Methods. (A) Each signal for nut-1/PAN transcription is aligned vertically with the corresponding signal for 7SK. (B) Signals were quantitated by phosphorimager and graphed as relative units. (C) Each nut-1/PAN reporter signal was divided by the corresponding 7SK signal. Activation (n-fold) was calculated by dividing each of the resulting ORF57-stimulated values from that of the value from vector-transfected cells alone, which was normalized to 1. The error bars indicate standard deviations.
FIG. 8.
FIG. 8.
Promoter-specific transactivation by Mta functions at the levels of transcription and RNA stability. 293 cells were cotransfected in quadruplicate with the reporter plasmid pGL3-nut1 (−706) (A) or pCMV-Luc (B) and the expression vectors indicated at the top. Half of each set of transfections was treated with ActD, as indicated, and total RNA was analyzed by Northern blotting using the luciferase (lucif) gene or 7SK transcript (cellular control) as a probe. Each signal was quantitated by phosphorimager. Relative activity was calculated by normalizing each pair of luciferase signals to each other by comparison to the corresponding pairs of signals for the cellular 7SK transcript. Each normalized signal in panel A or B was then divided by the signals from lanes 1 and 2, which were set at 1. The numbers above each luciferase panel represent the average of the pair of resulting signals, with each corresponding standard deviation in parentheses.
FIG. 9.
FIG. 9.
ORF50/Rta and ORF57/Mta proteins interact physically. (A) Coimmunoprecipitations. Total protein extracts from induced PEL cells were incubated with the indicated antisera, as described in Materials and Methods. Immunoprecipitated (IP) proteins were displayed by SDS-PAGE and analyzed by Western blotting using horseradish peroxidase (HRP)-conjugated anti-Rta or anti-Mta sera, as indicated. (B) Schematic of ORF50/Rta protein and deletions. The box shows structural and functional protein domains of the 691-aa ORF50/Rta protein. The bars below represent each of the deletion mutants used in Fig. 7C. ++, basic amino acids; E3, E3 ubiquitin ligase activity (109); LR, leucine rich (10); NLS, nuclear localization signal; AD, activation domain (56, 98). (C) GST pull downs. GST-Mta or GST moiety alone was immobilized on glutathione-agarose beads and incubated with the indicated 35S-labeled Rta proteins (from programmed RRL). Following washes, the beads were boiled in 2× Laemmli buffer, and bound proteins were electrophoresed on a 10% denaturing polyacrylamide gel. The fixed, amplified, and dried gels were analyzed by autoradiography.
FIG. 10.
FIG. 10.
ORF57/Mta is a DNA-binding protein. (A) Expression and purification of His6-Mta in E. coli. His6-Mta protein was expressed and purified from E. coli, as described in Materials and Methods. Equal volumes of flowthrough (FT) and the indicated fractions were analyzed by SDS-PAGE, followed by visualization using Gel-Code Blue stain. (B) His6-Mta binds to nut-1/PAN promoter DNA in vitro. A DNA spanning bp −73 to +26 of the nut-1/PAN promoter (Fig. 3A) was end labeled with 32P and incubated with DNA-binding buffer alone or increasing amounts of His6-Mta or His6-RPB-Jk protein, as indicated. Nondenaturing PAGE was used to analyze each reaction, the gel was dried, and signals were visualized by autoradiography. (C) His6-Mta binds to the nut-1/PAN promoter in vivo. ChIP assays were performed as described in Materials and Methods using the indicated antisera and chromatin from uninduced (−TPA) or induced (+TPA) BC-3 cells. The nut-1/PAN promoter was detected and quantitated by real-time PCR; end products of the amplification were analyzed by agarose gel electrophoresis and visualized by staining them with ethidium bromide. − or +, omission or addition, respectively, of indicated proteins. The number of plus signs indicates the relative amount of protein added.
FIG. 11.
FIG. 11.
A lesion in Mta's putative A/T hook domain alters its association with promoter DNA and reduces Mta transactivation. (A) Mta primary structure map; a schematic of the ORF57/Mta protein. The numbers refer to amino acid positions. Asterisks, putative nuclear export signals; arrowheads, RXP tri-peptides; SR, serine-arginine dipeptide-rich domain; R, arginine-rich domain; L, leucine repeat; HCC, amino acids conserved in herpesviral Mta homologs (93). (B) Mta contains a putative A/T hook DNA-binding domain. Shown is an alignment of the putative AT hook motif of Mta with a sequence logo (19) created by comparison of selected A/T hook motifs contained in the protein block IPB000637B (38). The height of each amino acid in the logo represents the relative frequency of that residue at the indicated position. The lowercase r at position 8 in the Mta sequence is the only amino acid not commonly found in A/T hooks. (C) Deletion of the putative A/T hook alters the association of Mta with promoter DNA. Purified His6-Mta WT or MtaΔA/T protein was preincubated in buffer alone or with the unlabeled −73 to +26 nut-1/PAN promoter DNA (Fig. 3A) at two concentrations. Labeled probe was then added, and EMSA results were analyzed as described in the legend to Fig. 10B. (D) Deletion of the putative A/T hook reduces Mta-mediated transactivation of the nut-1/PAN promoter. The indicated amounts of expression vectors for the indicated proteins were cotransfected with the pGL3-nut1 (−706) reporter plasmid into 293 cells, and luciferase assays were performed as described in the legend to Fig. 6A. (E) Proteins expressed from the indicated vectors were visualized by immunofluorescence of transfected 293 cells as for Fig. 5A.

Similar articles

Cited by

References

    1. Agresti, A., and M. E. Bianchi. 2003. HMGB proteins and gene expression. Curr. Opin. Genet. Dev. 13:170-178. - PubMed
    1. Albrecht, R. A., S. K. Kim, and D. J. O'Callaghan. 2005. The EICP27 protein of equine herpesvirus 1 is recruited to viral promoters by its interaction with the immediate-early protein. Virology 333:74-87. - PubMed
    1. Albrecht, R. A., S. K. Kim, Y. Zhang, Y. Zhao, and D. J. O'Callaghan. 2004. The equine herpesvirus 1 EICP27 protein enhances gene expression via an interaction with TATA box-binding protein. Virology 324:311-326. - PubMed
    1. Aravind, L., and D. Landsman. 1998. AT-hook motifs identified in a wide variety of DNA-binding proteins. Nucleic Acids Res. 26:4413-4421. - PMC - PubMed
    1. AuCoin, D. P., K. S. Colletti, Y. Xu, S. A. Cei, and G. S. Pari. 2002. Kaposi's sarcoma-associated herpesvirus (human herpesvirus 8) contains two functional lytic origins of DNA replication. J. Virol. 76:7890-7896. - PMC - PubMed

Publication types

MeSH terms

LinkOut - more resources