. 2007 Dec;81(24):13743-53.
doi: 10.1128/JVI.01778-07. Epub 2007 Oct 3.

Allogeneic differences in the dependence on CD4+ T-cell help for virus-specific CD8+ T-cell differentiation

Affiliations

Allogeneic differences in the dependence on CD4+ T-cell help for virus-specific CD8+ T-cell differentiation

Christopher C Kemball et al. J Virol. 2007 Dec.

Abstract

CD4(+) T-cell help enables antiviral CD8(+) T cells to differentiate into fully competent memory cells and sustains CD8(+) T-cell-mediated immunity during persistent virus infection. We recently reported that mice of C57BL/6 and C3H strains differ in their dependence on CD28 and CD40L costimulation for long-term control of infection by polyoma virus, a persistent mouse pathogen. In this study, we asked whether mice of these inbred strains also vary in their requirement for CD4(+) T-cell help for generating and maintaining polyoma virus-specific CD8(+) T cells. CD4(+) T-cell-depleted C57BL/6 mice mounted a robust antiviral CD8(+) T-cell response during acute infection, whereas unhelped CD8(+) T-cell effectors in C3H mice were functionally impaired during acute infection and failed to expand upon antigenic challenge during persistent infection. Using (C57BL/6 x C3H)F(1) mice, we found that the dispensability for CD4(+) T-cell help for the H-2(b)-restricted polyoma virus-specific CD8(+) T-cell response during acute infection extends to the H-2(k)-restricted antiviral CD8(+) T cells. Our findings demonstrate that dependence on CD4(+) T-cell help for antiviral CD8(+) T-cell effector differentiation can vary among allogeneic strains of inbred mice.


Figures
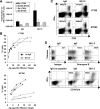
FIG. 1.
FIG. 1.
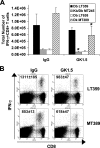
Effect of CD4+ T-cell depletion on PyV-specific CD8+ T-cell responses in acutely infected B6 and C3H mice. (A) Total numbers of splenic IFN-γ+ CD8+ T cells specific for DbLT359, Kb/Db MT245, and DbLT638 (B6 mice) and DkMT389 (C3H mice) during acute infection (day 7 to 8 p.i.) in MAb GK1.5- or control rat IgG-treated mice. The values plotted are the averages ± standard deviations (SD) of the results for three mice per group and are representative of two to three independent experiments. (B) Ex vivo cytotoxicity of DbLT359- and DkMT389-specific CD8+ T cells was measured on day 8 and 7 p.i., respectively, in MAb GK1.5- or control rat IgG-treated mice. The Ag-specific effector:target ratio was calculated for each mouse based on the frequency of DbLT359 or DkMT389 tetramer+ CD8+ splenocytes. Lysis of unpulsed targets was <5% at all effector:target ratios measured (data not shown). Data are representative of three independent experiments. (C) The MFI of intracellular IFN-γ staining was determined for splenic DbLT359- and DkMT389-specific CD8+ T cells at day 7 to 8 p.i. in MAb GK1.5- or control rat IgG-treated mice. Values shown on representative dot plots are the average MFI ± SD for three mice, and data are representative of three independent experiments. (D) The percentages of splenic DkMT389 tetramer+ CD8+ T cells expressing intracellular granzyme B were determined (top panels). Values shown on representative dot plots (gated on CD8+ T cells) are the mean percentages of tetramer+ cells that are granzyme B+ (mean ± SD of the results for three mice). Dot plot quadrant gates for granzyme B are set from an IgG1 isotype control. The degranulation capacities of peptide-stimulated MT389-specific IFN-γ+ CD8+ T cells were assessed by CD107a/b cell surface staining (bottom panels). The values shown on representative dot plots (gated on CD8+ T cells) are the mean percentages of IFN-γ+ cells that are CD107a/b+ (mean ± SD of the results for three mice). Data are representative of two independent experiments.
FIG. 2.
FIG. 2.
CD4+ T-cell depletion of PyV-infected mice has similar effects on antiviral memory CD8+ T-cell responses in B6 and C3H mice. (A) Total numbers of splenic IFN-γ+ CD8+ T cells specific for DbLT359, Kb/Db MT245, and DbLT638 (B6 mice) and DkMT389 (C3H mice) during persistent infection (day 42 to 43 p.i.) in mice treated with MAb GK1.5 or control rat IgG at the onset of infection. Values plotted are the averages ± standard deviations of the results for three mice per group and are representative of two to three independent experiments (*, P < 0.05). (B) The MFI of intracellular IFN-γ staining was determined for splenic DbLT359- and DkMT389-specific CD8+ T cells at day 42 to 43 p.i. in MAb GK1.5- or control rat IgG-treated mice. The values shown on representative dot plots are the average MFI ± standard deviations of the results for three mice, and the data are representative of three independent experiments.
FIG. 3.
FIG. 3.
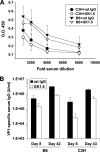
CD4+ T-cell depletion of PyV-infected mice diminishes the PyV-specific IgG response in both B6 and C3H mice. (A) VP1-specific serum IgM in MAb GK1.5- or control rat IgG-treated B6 and C3H mice on day 4 p.i., as determined by ELISA. Values plotted are the average optical densities ± standard errors for three mice per group. O.D. 450, optical density at 450 nm. (B) VP1-specific serum IgG titers during acute (day 7 to 8 p.i.) and persistent (day 42 to 43 p.i.) phases of infection in MAb GK1.5- or control rat IgG-treated B6 and C3H mice, expressed in arbitrary units. The values plotted are the averages ± standard deviations of the results for three mice per group.
FIG. 4.
FIG. 4.
Comparison of viral clearance in CD4+ T-cell-depleted B6 and C3H mice. (A) The viral titers in the spleens of B6 and C3H mice given MAb GK1.5 or control rat IgG were determined at the indicated day p.i. (B) The numbers of PyV genomes in the spleens were quantitated by TaqMan real-time PCR at the indicated day p.i. Each point represents an individual mouse, and the bars indicate the means (*, P < 0.05).
FIG. 5.
FIG. 5.
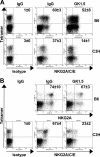
CD4+ T-cell depletion differentially affects the expression of CD94/NKG2A by PyV-specific CD8+ T cells in B6 and C3H mice. CD94/NKG2A expression on splenic DbLT359 and DkMT389 tetramer+ CD8+ T cells in MAb GK1.5- or control rat IgG-treated mice was evaluated during the acute (A) (day 7 to 8 p.i.) and persistent (B) (day 42 to 43 p.i.) phases of infection. Dot plot quadrant gates are set from IgG2a isotype controls. The values shown on the representative dot plots (gated on CD8+ T cells) are the mean percentages of tetramer+ cells that are CD94/NKG2A+ (means ± standard deviations of the results for three mice), and the data are representative of two independent experiments.
FIG. 6.
FIG. 6.
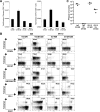
PyV-specific memory CD8+ T cells in CD4+ T-cell-depleted C3H mice fail to expand and are phenotypically altered following Ag-specific rechallenge. Persistently PyV-infected C3H mice (treated weekly with MAb GK1.5 or control rat IgG from the onset of PyV infection) were rechallenged on day 54 p.i. with a recombinant VV encoding the MT389-397 epitope (VV-MT389) or with the control, VV-WR, and T-cell responses were analyzed 4 days later. (A) Total numbers of splenic DkMT389 tetramer+ CD8+ T cells and MT389-specific IFN-γ+ CD8+ T cells. The values plotted are the means ± standard deviations of the results for three mice per group. (B) Percentages of DkMT389 tetramer+ CD8+ T cells in the spleen expressing CD62L, CD127, CD94/NKG2A, PD-1, or CD27. The values shown on the representative dot plots (gated on CD8+ T cells) are the mean percentages of tetramer+ cells that are CD62Llow, CD127low, NKG2A+, PD-1+, or CD27high (means ± standard deviations of the results for three mice). Dot plot quadrant gates for NKG2A and PD-1 are set from IgG2a and IgG2b isotype controls, respectively. (C) VV titers in ovaries of MAb GK1.5- or rat IgG-treated C3H mice at day 4 after VV-MT389 or VV-WR challenge infection. Each point represents an individual mouse, and the bars indicate the means. No VV was detected in the ovaries of IgG-treated, VV-MT389-rechallenged mice. All data are representative of two independent experiments.
FIG. 7.
FIG. 7.
The B6 phenotype is dominant to the unhelped PyV-specific CD8+ T-cell phenotype of C3H mice. (A) Total numbers of splenic DkMT389 and DbLT359 tetramer+ CD8+ T cells at day 8 p.i. in MAb GK1.5- or control rat IgG-treated B6C3F1 mice. Values plotted are the averages ± standard deviations of the results for four mice per group (*, P < 0.05; **, P < 0.01). (B) The percentages of splenic DkMT389 or DbLT359 tetramer+ CD8+ T cells that expressed CD94/NKG2A or granzyme B were determined by flow cytometry. The values shown on the representative dot plots (gated on CD8+ T cells) are the mean percentages of tetramer+ cells that are NKG2A+ or granzyme B+ (mean ± standard deviation of the results for four mice). Dot plot quadrant gates for NKG2A and granzyme B are set from IgG2a and IgG1 isotype controls, respectively. (C) Ex vivo cytotoxicity of DkMT389- and DbLT359-specific CD8+ T cells was measured at day 8 p.i. in MAb GK1.5- or control rat IgG-treated mice. The Ag-specific effector:target ratio was calculated for each mouse based on the frequency of DkMT389 or DbLT359 tetramer+ CD8+ splenocytes. Lysis of unpulsed AG104A or RMA/S target cells was <5% and <15%, respectively, at all effector:target ratios measured (data not shown). All data are representative of two independent experiments.

Similar articles

Cited by

References

    1. Andrews, N. P., C. D. Pack, V. Vezys, G. N. Barber, and A. E. Lukacher. 2007. Early virus-associated bystander events affect the fitness of the CD8 T cell response to persistent virus infection. J. Immunol. 178:7267-7275. - PubMed
    1. Baars, P. A., S. Sierro, R. Arens, K. Tesselaar, B. Hooibrink, P. Klenerman, and R. A. van Lier. 2005. Properties of murine CD8+CD27− T cells. Eur. J. Immunol. 35:3131-3141. - PubMed
    1. Badovinac, V. P., and J. T. Harty. 2007. Manipulating the rate of memory CD8+ T cell generation after acute infection. J. Immunol. 179:53-63. - PubMed
    1. Badovinac, V. P., K. A. Messingham, A. Jabbari, J. S. Haring, and J. T. Harty. 2005. Accelerated CD8+ T-cell memory and prime-boost response after dendritic-cell vaccination. Nat. Med. 11:748-756. - PubMed
    1. Belz, G. T., D. Wodarz, G. Diaz, M. A. Nowak, and P. C. Doherty. 2002. Compromised influenza virus-specific CD8+-T-cell memory in CD4+-T-cell-deficient mice. J. Virol. 76:12388-12393. - PMC - PubMed

Publication types

MeSH terms