. 2007 Oct 9;104(41):16182-7.
doi: 10.1073/pnas.0708047104. Epub 2007 Oct 3.

Microtubule-based nuclear movement occurs independently of centrosome positioning in migrating neurons

Affiliations

Microtubule-based nuclear movement occurs independently of centrosome positioning in migrating neurons

Hiroki Umeshima et al. Proc Natl Acad Sci U S A. .

Abstract

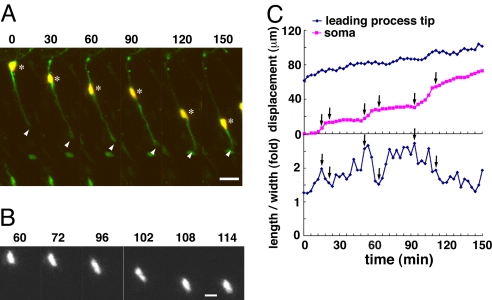
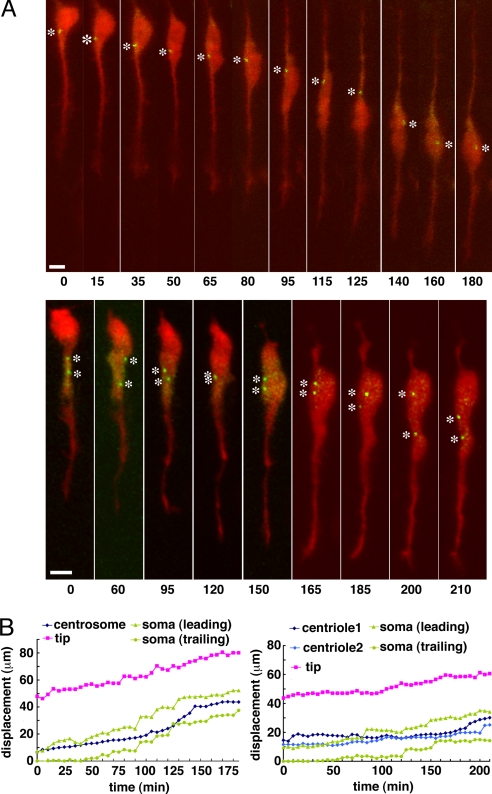
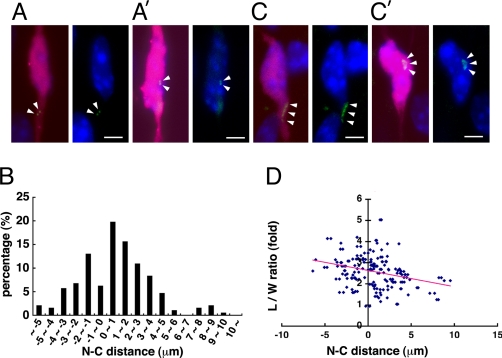
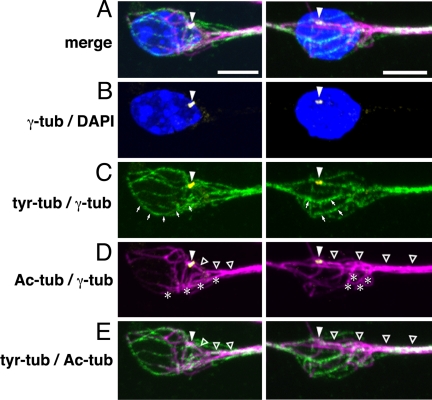
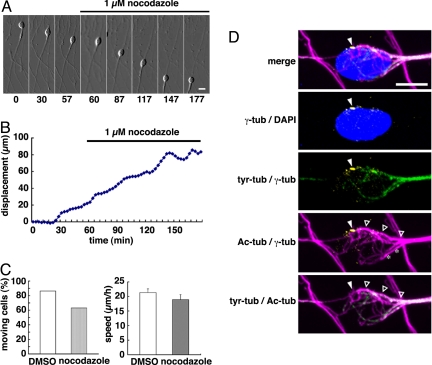
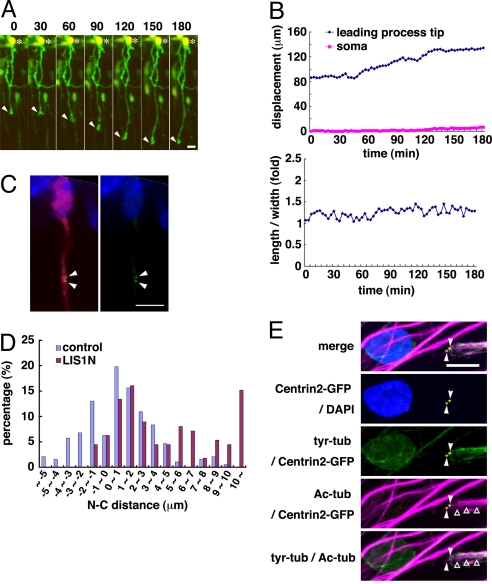
During neuronal migration in the developing brain, it is thought that the centrosome precedes the nucleus and provides a cue for nuclear migration along the microtubules. In time-lapse imaging studies of radially migrating granule cells in mouse cerebellar slices, we observed that the movements of the nucleus and centrosome appeared to occur independently of each other. The nucleus often migrated ahead of the centrosome during its saltatory movement, negating the supposed role of the centrosome in pulling the nucleus. The nucleus was associated with dynamic microtubules enveloping the entire nucleus and stable microtubules extending from the leading process to the anterior part of the nucleus. Neither of these perinuclear microtubules converged at the centrosome. Disruption or excess formation of stable microtubules attenuated nuclear migration, indicating that the configuration of stable microtubules is crucial for nuclear migration. The inhibition of LIS1 function, a regulator of a microtubule motor dynein, specifically blocks nuclear migration without affecting the coupling of the centrosome and microtubules in the leading process, suggesting that movements of the nucleus and centrosome are differentially regulated by dynein motor function. Thus, the nucleus moves along the microtubules independently of the position of the centrosome in migrating neurons.


Conflict of interest statement

The authors declare no conflict of interest.

Figures

Fig. 1.
Fig. 1.
Saltatory movements of the nucleus occur independently of leading process extension in radial migration of granule cells. (A) Time-lapse sequence of granule cells undergoing radial migration in the ML in P10 mouse cerebella shown in SI Movie 2. Cells were coelectroporated with pCAG-EGFP and pCAG-DsRed2-Nuc to visualize the cell morphology (green) and nucleus (red), respectively. Coronal slices were made 48 h after in vivo electroporation and imaged every 3 min. Asterisks and arrowheads indicate nuclei and leading process tips, respectively. Times in all time-lapse images are indicated in minutes. Panels are oriented pial side up, with white matter side down. (B) Imaging of the nucleus of the neuron shown in A at different time points. (C) Positions of the leading process tip (blue in Upper) and approximated oval center of the nucleus (magenta in Upper) and the length/width ratio of the nucleus (Lower) in neurons shown in A plotted against time. Nuclear migration consists of clear fast-moving and resting (slow-moving) phases, whereas leading process extension is relatively constant. The length/width ratio (the ratio of nuclear diameter along the leading and trailing poles relative to diameter along perpendicular axis) roughly correlated with the nuclear translocation and increased at the onset of the fast moving phases (arrows). (Scale bars: 20 μm, A; 10 μm, B.)
Fig. 2.
Fig. 2.
The soma translocates past the centrosome toward the leading process during radial migration of granule cells. (A) Time-lapse laser-confocal images of granule cells (Cell 1, Upper; Cell 2, Lower) in the ML transduced with pCAG-DsRed-Express and pCentrin2-GFP (5-min intervals; see also SI Movies 3 and 4). Times are indicated in minutes. Panels are oriented pial side up. Centrosomes labeled with Centrin2-GFP (green) indicated by asterisks were mostly located ahead of the soma in the direction of migration in the outer ML (time point 0). The two centrioles were occasionally observed separated from each other (Lower). Long, saltatory movements of the soma surpassed the centrosome (Upper) or both centrioles (Lower). (Scale bars: 5 μm.) (B) Graphs of the positions of the leading process tip (magenta), centrosome (dark and light blue), and the leading and trailing poles of the soma (green) of neurons shown in A plotted against time. (Left) Cell 1. (Right) Cell 2. The nucleus migrated past the centrosome until the centrosome reached the rear pole of the soma after serial nuclear movements. The centrosome moved at a constant speed comparable to the leading process extension, then advanced rapidly to the front when it reached the cell rear.
Fig. 3.
Fig. 3.
Localization of the centrosome and Golgi apparatus in migrating granule cells in the ML. (A and A′) Visualization of centrosomes in granule cells coelectroporated with DsRed-Express (pseudocolored in magenta) and Centrin2-GFP (green), then sectioned and stained with DAPI (blue). Centrosomes were positioned either in front of the nucleus (A) or within the soma (A′). (B) Histogram of the positions of the centrosomes within migrating granule cells. The distances (micrometers) from the leading pole of the nucleus (point 0) to the leading process (plus; right) and the soma (minus; left) are represented along the x axis and the percentages of total neuron number in each bin is represented along the y axis. Significant numbers of centrosomes were observed behind the leading poles of the nuclei. (C and C′) Visualization of the Golgi apparatus in granule cells transduced with DsRed-Express, then immunostained with anti-GM130. The Golgi apparatus in some cells was positioned ahead of the nucleus (C), whereas others were localized within the soma (C′). (D) Correlation of centrosomal position and nuclear shape. The centrosomal position measured in B relative to the length/width ratio of the nucleus is shown. The length/width ratio was calculated as described in Fig. 1. The solid line represents linear regression (r2 = 0.087). (Scale bars: 5 μm.)
Fig. 4.
Fig. 4.
The microtubule cytoskeleton of migrating granule cells. (Left) Cell 1. (Right) Cell 2. Granule cells in cerebellar reaggregate cultures were multiply stained for γ-tubulin (pseudocolored in yellow), tyr-tubulin (green), Ac-tubulin (magenta), and DAPI (blue). Panels are oriented with the forward direction of migration (distal side of the explant) to the right, and backward (proximal side) to the left. (A) Merged view. (B) Immunostaining for γ-tubulin showed that the centrosome (arrowheads) was located in front of the nucleus (Left) or within the soma (Right). (C) Dynamic microtubules rich in tyr-tubulin form the perinuclear microtubule cage. Some of the microtubule filaments appeared not to converge at the centrosome (arrows). (D) Stable microtubules rich in Ac-tubulin form a whisk-like structure at the anterior surface of the nucleus. The stable perinuclear microtubules extend from the leading process independent of the centrosome (asterisks). Thick bundles of stable microtubules in the leading process (open arrowheads) were converged at the centrosome whether it was located ahead or behind the anterior pole of the nucleus. (E) Merged view of C and D. (Scale bars: 5 μm.)
Fig. 5.
Fig. 5.
The stable microtubules are sufficient for driving nuclear migration. (A) The application of 1 μM nocodazole did not inhibit granule cell migration in a reaggregate culture (see also SI Movie 6). Times in all time-lapse images are indicated in minutes. (B) Graphs indicate the positions of the cell body of the neuron shown in A plotted against time. Nocodazole was added at 60 min. (C) Percentage of migrating cells that moved >20 μm in 2 h (Left) and the average speed (Right) after treatment with DMSO (control) or nocodazole. (D) The addition of 1 μM nocodazole selectively disrupted dynamic microtubules. Perinuclear microtubule cages consisting of tyr-tubulin (green) were scarcely formed, whereas Ac-tubulin-positive stable microtubules (magenta) that were associated with the anterior half of the nucleus (asterisks) and those linked to the centrosome (open arrowheads) remained intact. Filled arrowheads indicate the position of centrosome. Panels are oriented with the forward direction of migration to the right. (Scale bars: 10 μm, A; 5 μm, D.)
Fig. 6.
Fig. 6.
Inhibition of LIS1 disrupts nuclear migration but not centrosome migration in granule cells. (A) Time-lapse laser-confocal images of granule cells in cerebellar slice transduced with LIS1N, pCAG-EGFP, and pCAG-DsRed2-Nuc (see SI Movie 9). Times are indicated in minutes. (B) Positions of the leading process tip (blue in Upper) and approximated oval center of the nucleus (magenta in Upper) and the length/width ratio of the nucleus (Lower) in neurons shown in A plotted against time. Nuclear migration is inhibited, whereas constant extension of the leading process is not affected. Periodical stretching of the nucleus is not seen. (C) Positions of the centrosome and nucleus in granule cells overexpressing LIS1N. Granule cells were transduced with DsRed-Express (pseudocolored in magenta), LIS1N, and Centrin2-GFP (green), and then sectioned and stained with DAPI (blue) 48 h after electroporation. (D) Histogram of the position of the centrosome in control (blue) and LIS1N-expressing granule cells (magenta). LIS1 inhibition increased the nucleus–centrosome distance, indicated by a rightward shift in the bin distribution. (E) LIS1 inhibition did not affect the coupling of the centrosome and leading process. Granule cells in a reaggregate culture were cotransduced with Centrin2-GFP (yellow) and LIS1N and stained for tyr-tubulin (green), Ac-tubulin (magenta), and DAPI (blue). Panels are oriented with the forward direction of migration to the right. The stable microtubule bundles in the leading process (open arrowheads) were tightly associated with the centrosome far ahead of the nucleus (filled arrowheads). Because LIS1-deficient cells failed to travel a long distance from the explant, bundles of Ac-tubulin derived from leading processes of other cells overlapped with the nucleus. (Scale bars: 10 μm, A; 5 μm, C and E.)

Similar articles

Cited by

References

    1. Hatten ME. Science. 2002;297:1660–1663. - PubMed
    1. Edmondson JC, Hatten ME. J Neurosci. 1987;7:1928–1934. - PMC - PubMed
    1. Lambert de Rouvroit C, Goffinet AM. Mech Dev. 2001;105:47–56. - PubMed
    1. Ridley AJ, Schwartz MA, Burridge K, Firtel RA, Ginsberg MH, Borisy G, Parsons JT, Horwitz AR. Science. 2003;302:1704–1709. - PubMed
    1. Komuro H, Rakic P. J Neurosci. 1998;18:1478–1490. - PMC - PubMed

Publication types

Substances