

Modeling a layer 4-to-layer 2/3 module of a single column in rat neocortex: interweaving in vitro and in vivo experimental observations
- PMID: 17913876
- PMCID: PMC2000451
- DOI: 10.1073/pnas.0707853104
Modeling a layer 4-to-layer 2/3 module of a single column in rat neocortex: interweaving in vitro and in vivo experimental observations
Abstract
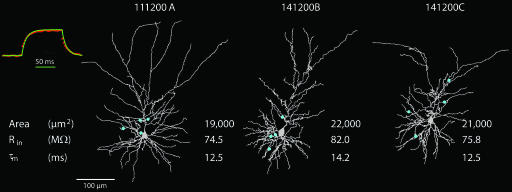
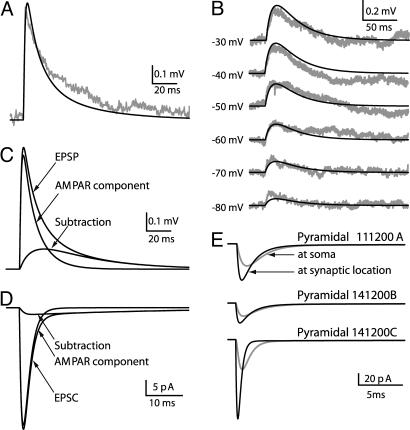
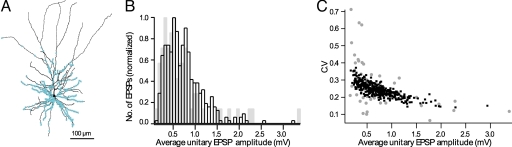
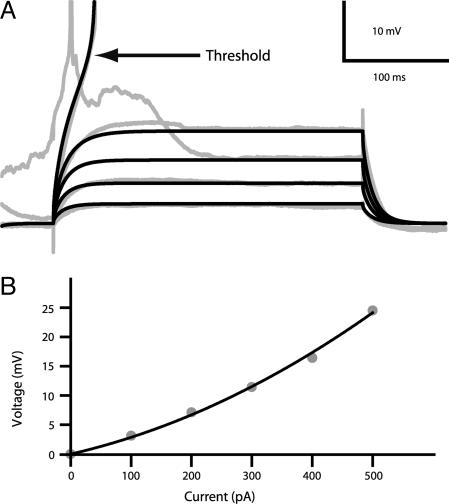
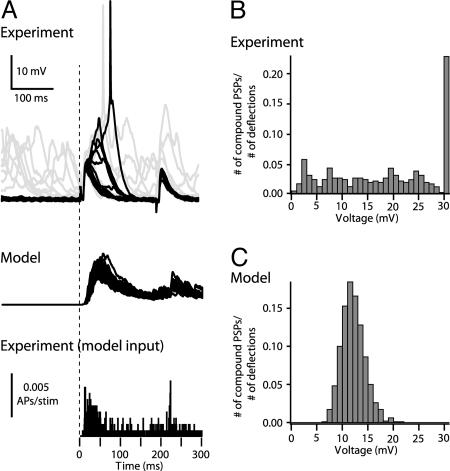
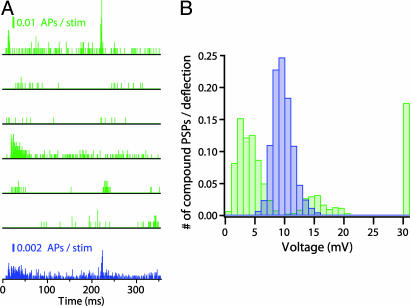
We report a step in constructing an in silico model of a neocortical column, focusing on the synaptic connection between layer 4 (L4) spiny neurons and L2/3 pyramidal cells in rat barrel cortex. It is based first on a detailed morphological and functional characterization of synaptically connected pairs of L4-L2/3 neurons from in vitro recordings and second, on in vivo recordings of voltage responses of L2/3 pyramidal cells to current pulses and to whisker deflection. In vitro data and a detailed compartmental model of L2/3 pyramidal cells enabled us to extract their specific membrane resistivity ( approximately 16,000 ohms x cm(2)) and capacitance ( approximately 0.8 microF/cm(2)) and the spatial distribution of L4-L2/3 synaptic contacts. The average peak conductance per L4 synaptic contact is 0.26 nS for the alpha-amino-3-hydroxy-5-methyl-4-isoxazolepropionic acid and 0.2 nS for NMDA receptors. The in vivo voltage response for current steps was then used to calibrate the model for in vivo conditions in the Down state. Consequently, the effect of a single whisker deflection was modeled by converging, on average, 350 +/- 20 L4 axons onto the modeled L2/3 pyramidal cell. Based on values of synaptic conductance, the spatial distribution of L4 synapses on L2/3 dendrites, and the average in vivo spiking probability of L4 spiny neurons, the model predicts that the feed-forward L4-L2/3 connection on its own does not fire the L2/3 neuron. With a broader distribution in the number of L4 neurons or with slight synchrony among them, the L2/3 model does spike with low probability.
Conflict of interest statement
The authors declare no conflict of interest.
Figures
Similar articles
-
Contribution of intracolumnar layer 2/3-to-layer 2/3 excitatory connections in shaping the response to whisker deflection in rat barrel cortex.Cereb Cortex. 2015 Apr;25(4):849-58. doi: 10.1093/cercor/bht268. Epub 2013 Oct 27. Cereb Cortex. 2015. PMID: 24165834 Free PMC article.
-
Synaptic connections between layer 4 spiny neurone-layer 2/3 pyramidal cell pairs in juvenile rat barrel cortex: physiology and anatomy of interlaminar signalling within a cortical column.J Physiol. 2002 Feb 1;538(Pt 3):803-22. doi: 10.1113/jphysiol.2001.012959. J Physiol. 2002. PMID: 11826166 Free PMC article.
-
Synaptic Conductance Estimates of the Connection Between Local Inhibitor Interneurons and Pyramidal Neurons in Layer 2/3 of a Cortical Column.Cereb Cortex. 2015 Nov;25(11):4415-29. doi: 10.1093/cercor/bhv039. Epub 2015 Mar 10. Cereb Cortex. 2015. PMID: 25761638 Free PMC article.
-
Morphometric analysis of the columnar innervation domain of neurons connecting layer 4 and layer 2/3 of juvenile rat barrel cortex.Cereb Cortex. 2003 Oct;13(10):1051-63. doi: 10.1093/cercor/13.10.1051. Cereb Cortex. 2003. PMID: 12967922
-
Physiology and anatomy of synaptic connections between thick tufted pyramidal neurones in the developing rat neocortex.J Physiol. 1997 Apr 15;500 ( Pt 2)(Pt 2):409-40. doi: 10.1113/jphysiol.1997.sp022031. J Physiol. 1997. PMID: 9147328 Free PMC article.
Cited by
-
Human Cortical Pyramidal Neurons: From Spines to Spikes via Models.Front Cell Neurosci. 2018 Jun 29;12:181. doi: 10.3389/fncel.2018.00181. eCollection 2018. Front Cell Neurosci. 2018. PMID: 30008663 Free PMC article.
-
The less things change, the more they are different: contributions of long-term synaptic plasticity and homeostasis to memory.Learn Mem. 2014 Feb 14;21(3):128-34. doi: 10.1101/lm.027326.112. Learn Mem. 2014. PMID: 24532836 Free PMC article. Review.
-
Contribution of intracolumnar layer 2/3-to-layer 2/3 excitatory connections in shaping the response to whisker deflection in rat barrel cortex.Cereb Cortex. 2015 Apr;25(4):849-58. doi: 10.1093/cercor/bht268. Epub 2013 Oct 27. Cereb Cortex. 2015. PMID: 24165834 Free PMC article.
-
Time-warp-invariant neuronal processing.PLoS Biol. 2009 Jul;7(7):e1000141. doi: 10.1371/journal.pbio.1000141. Epub 2009 Jul 7. PLoS Biol. 2009. PMID: 19582146 Free PMC article.
-
The Effects of NMDA Receptor Blockade on Sensory-Evoked Responses in Superficial Layers of the Rat Barrel Cortex.Front Cell Neurosci. 2019 Jun 7;13:259. doi: 10.3389/fncel.2019.00259. eCollection 2019. Front Cell Neurosci. 2019. PMID: 31231195 Free PMC article.
References
Publication types
MeSH terms
Substances
LinkOut - more resources
Full Text Sources
Miscellaneous
