. 2007 Oct 3;27(40):10659-73.
doi: 10.1523/JNEUROSCI.3134-07.2007.

Supplementary motor area and presupplementary motor area: targets of basal ganglia and cerebellar output

Affiliations

Supplementary motor area and presupplementary motor area: targets of basal ganglia and cerebellar output

Dalila Akkal et al. J Neurosci. .

Abstract

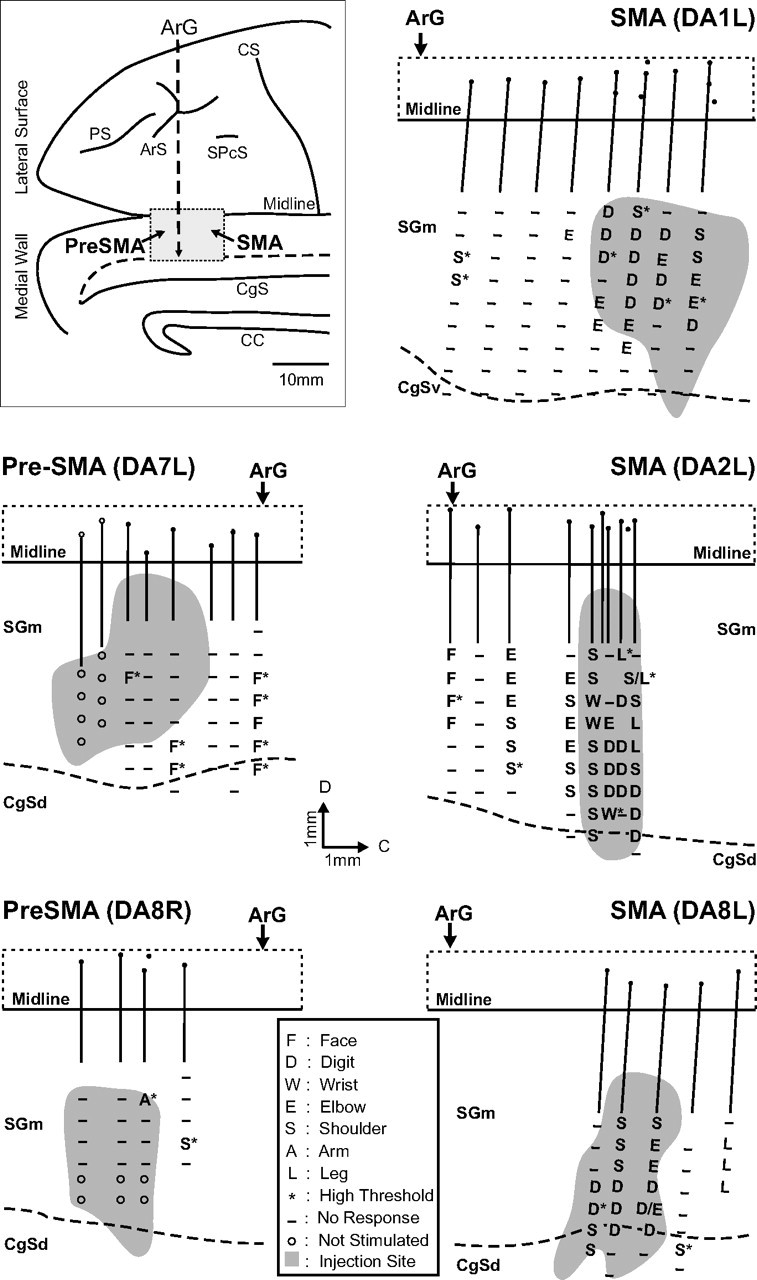
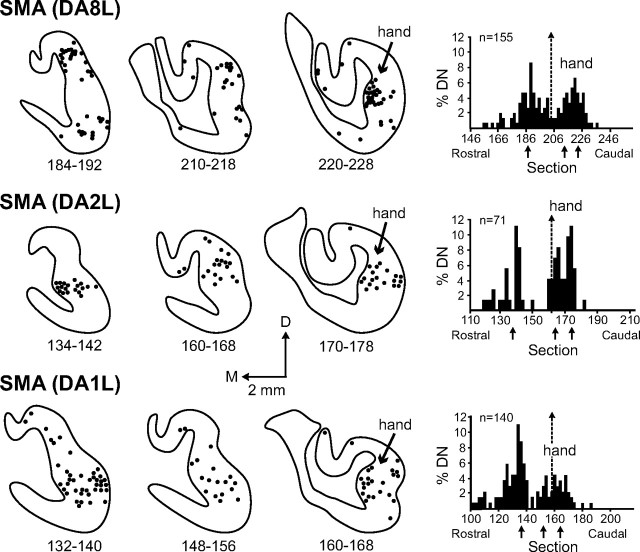
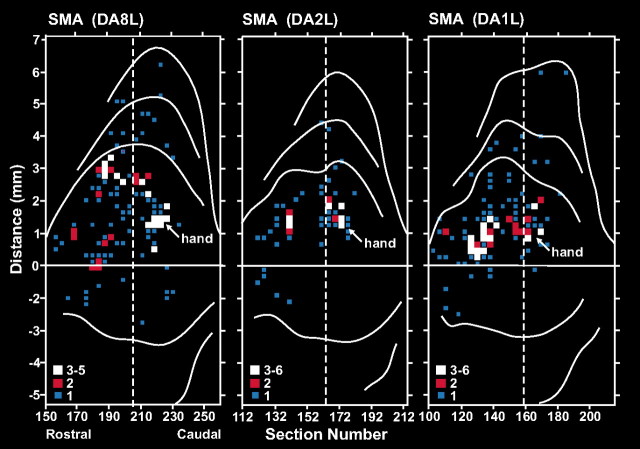
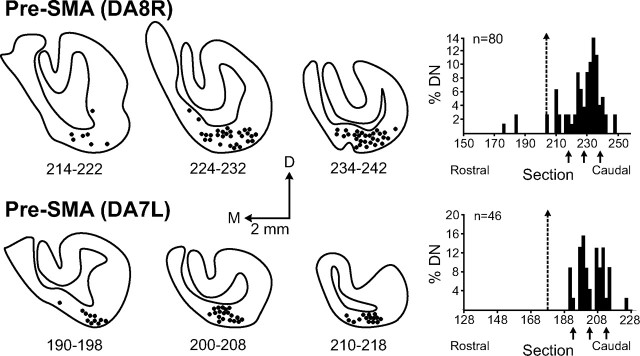
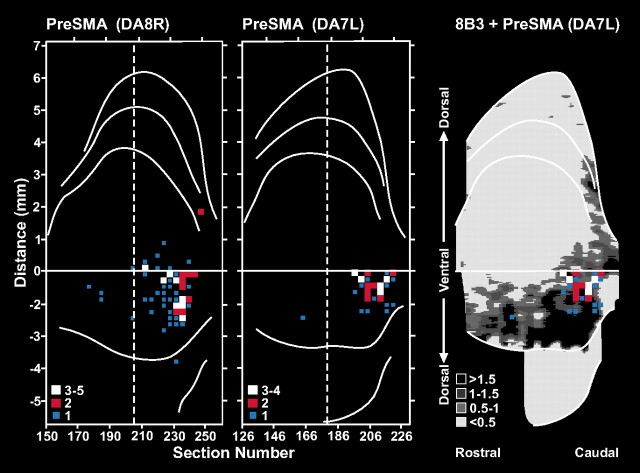
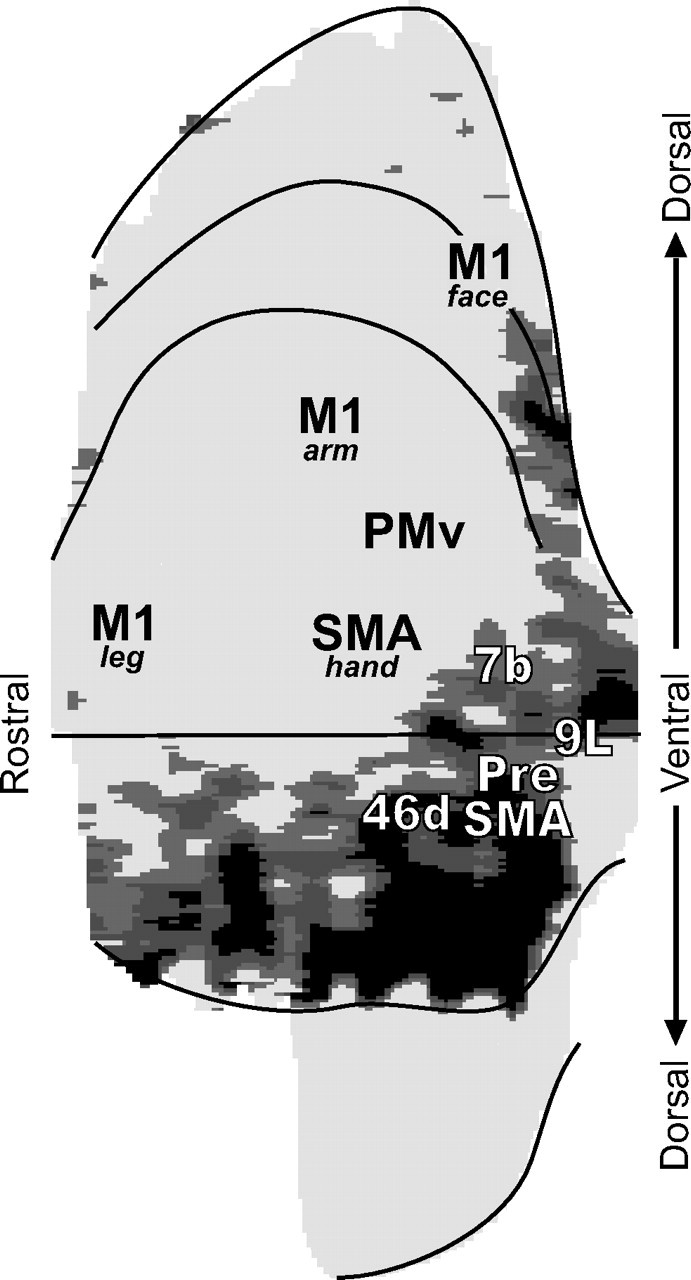
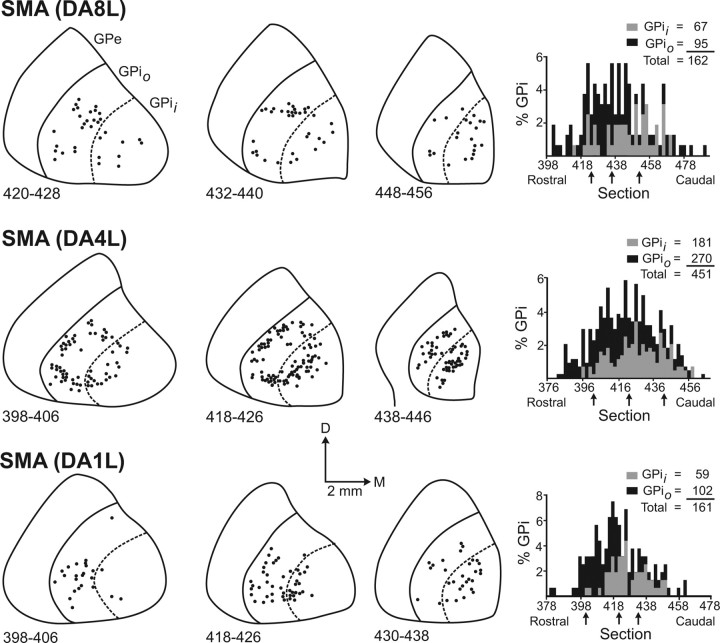
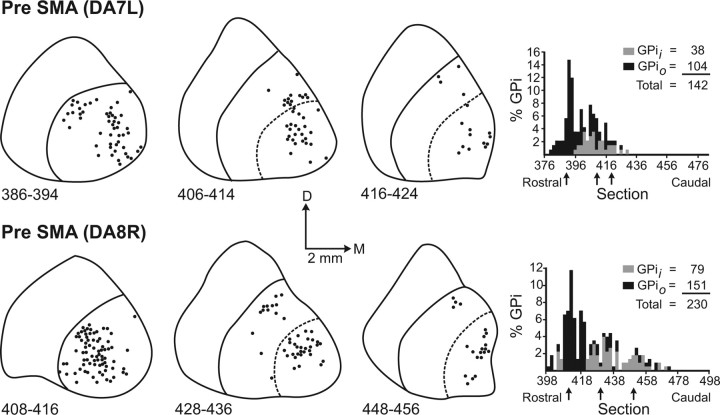
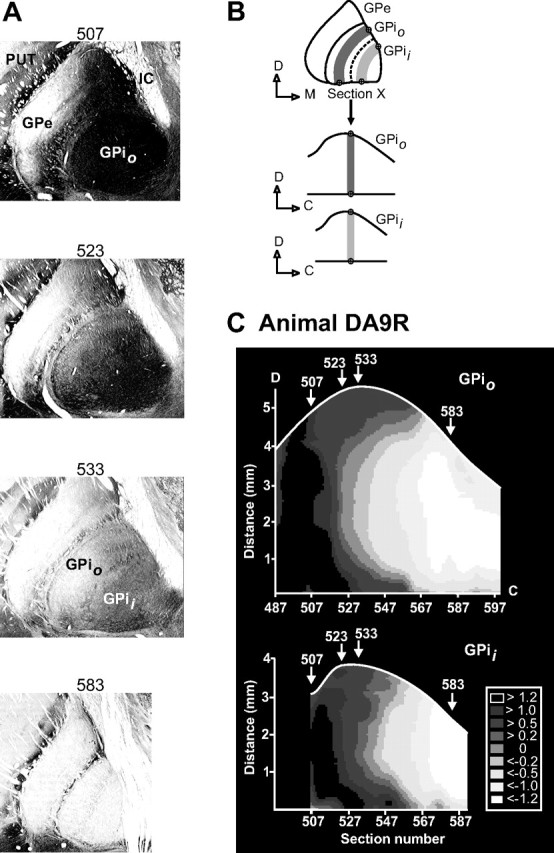
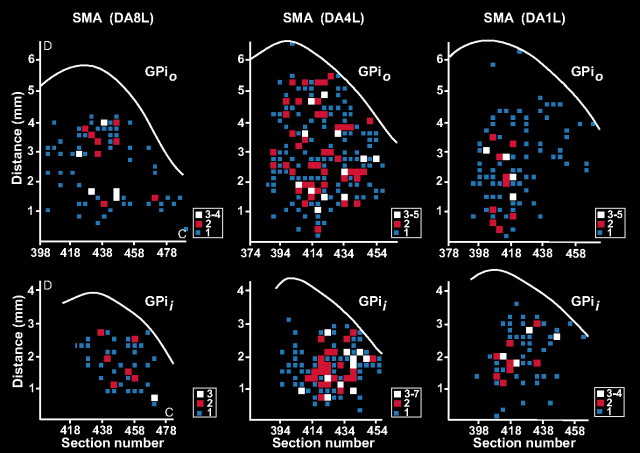
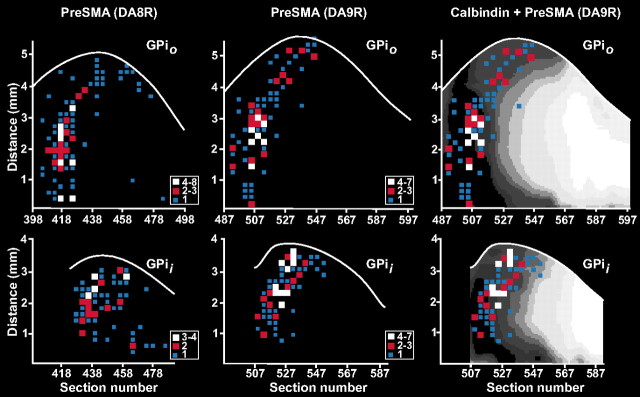
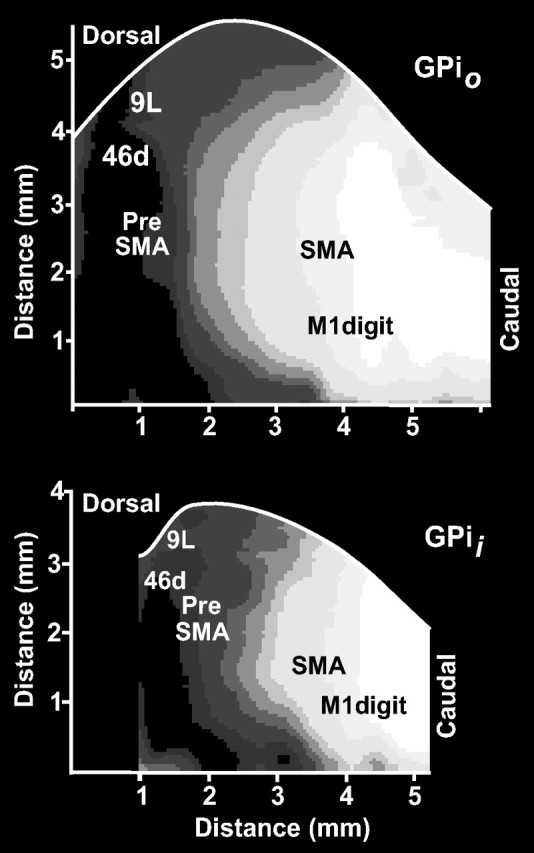
We used retrograde transneuronal transport of neurotropic viruses in Cebus monkeys to examine the organization of basal ganglia and cerebellar projections to two cortical areas on the medial wall of the hemisphere, the supplementary motor area (SMA) and the pre-SMA. We found that both of these cortical areas are the targets of disynaptic projections from the dentate nucleus of the cerebellum and from the internal segment of the globus pallidus (GPi). On average, the number of pallidal neurons that project to the SMA and pre-SMA is approximately three to four times greater than the number of dentate neurons that project to these cortical areas. GPi neurons that project to the pre-SMA are located in a rostral, "associative" territory of the nucleus, whereas GPi neurons that project to the SMA are located in a more caudal and ventral "sensorimotor" territory. Similarly, dentate neurons that project to the pre-SMA are located in a ventral, "nonmotor" domain of the nucleus, whereas dentate neurons that project to the SMA are located in a more dorsal, "motor" domain. The differential origin of subcortical projections to the SMA and pre-SMA suggests that these cortical areas are nodes in distinct neural systems. Although both systems are the target of outputs from the basal ganglia and the cerebellum, these two cortical areas seem to be dominated by basal ganglia input.


Figures

Figure 1.
Figure 1.
Location of injection sites in the SMA and pre-SMA. In the top left inset, the regions containing the SMA and pre-SMA are outlined on dorsal and medial views of the right hemisphere of a Cebus monkey. The right panels show maps of the intracortical stimulation and injection sites in the SMA of three monkeys (DA1, DA2L, and DA8L). The bottom left panels show maps of the intracortical stimulation and injection sites in the pre-SMA of two monkeys (DA7L and DA8R). The site of each microelectrode penetration (vertical line) in each map is indicated on the cortical surface by a dot. Tracks where no stimulation was attempted are indicated by open dots. The motor response evoked by stimulation along each track is indicated by a letter code at each stimulation site (see legend between the bottom right and left panels). The shaded region in each panel indicates the virus injection site. The asterisks indicate sites were the threshold to evoke movement was >50 μA. ArS, Arcuate sulcus; ArG, level of the genu of the arcuate sulcus; CS, central sulcus; PS, principal sulcus; SPcS, superior precentral sulcus; CC, corpus callosum; CgS, cingulate sulcus; SGm, medial part of the superior frontal gyrus; CgSd, dorsal bank of the cingulate sulcus; CgSv, ventral bank of the cingulate sulcus.
Figure 2.
Figure 2.
Second-order labeling in the dentate nucleus after virus injections into the SMA. Left, Coronal sections through the dentate nucleus of animals that received injections of virus into the SMA. Each black dot indicates the location of an infected neuron labeled by retrograde transneuronal transport (second-order neurons). Labeled cells from five sections spaced 100 μm apart are superimposed on each outline of the dentate. Section numbers are indicated below each plot. M, Medial; D, dorsal. Note that one cluster of labeled neurons (indicated by arrow “hand”) was present in all cases in which the injection site in the SMA included its hand representation. Right, Histograms of the rostrocaudal distribution of labeled neurons in the dentate for each case. Arrows indicate the levels of the sections plotted on the left. Dashed arrows indicate the rostrocaudal midpoint of each nucleus. n, The number of neurons labeled in each case (from counts of every other section); % DN, percentage of total labeled cells in the dentate nucleus.
Figure 3.
Figure 3.
Unfolded maps of the dentate neurons that project to the SMA. The panels show unfolded maps indicating the distribution and density of second-order neurons that were labeled by retrograde transneuronal transport of virus from the SMA. The maps were generated from plots of every other coronal section through the dentate. The colored squares are color coded to indicate the number of labeled neurons in 200 μm bins throughout the nucleus (the color code is given in the bottom left corner of each panel). See Materials and Methods for the procedures used to unfold and chart the density of labeled neurons in the dentate.
Figure 4.
Figure 4.
Second-order labeling in the dentate nucleus after virus injections into the pre-SMA. Conventions are as in Figure 2.
Figure 5.
Figure 5.
Unfolded maps of the dentate neurons that project to the pre-SMA. Conventions are as in Figure 3. On the right, a gradient density map of staining in the dentate of DA7L with antibody 8B3 [adapted from Dum et al. (2002)] is shown. The intensity of 8B3 immunoreactivity was contoured into four grayscale levels from the most intense staining (darkest) to the least intense staining (lightest). The units are in SDs from the mean. The location of dentate neurons labeled after a virus injection into the pre-SMA of this animal is overlaid on this map.
Figure 6.
Figure 6.
Summary map of the dentate output channels and their relationship to 8B3 immunoreactivity. The location of known output channels in the dentate is overlaid on a map of 8B3 staining. The cortical target of the output channel is placed at the site of the peak labeling after retrograde transneuronal transport of virus from that cortical area [adapted from Dum and Strick (2003)].
Figure 7.
Figure 7.
Second-order labeling in the GPi after virus injections into the SMA. Left, Coronal sections through the GPi nucleus from animals that received injections of virus into the SMA. Each black dot indicates the location of an infected neuron labeled by retrograde transneuronal transport (second-order neurons). Labeled cells from five sections spaced 100 μm apart are superimposed on each outline of GPi. Section numbers are indicated below each plot. Right, Histograms of the rostrocaudal distribution of labeled neurons in the GPi for each case. Arrows indicate the location of the sections shown on the left. GPii, Inner portion of the GPi; GPio, outer portion of GPi; Total, total number of labeled neurons for each case.
Figure 8.
Figure 8.
Second-order labeling in the GPi after virus injections into the pre-SMA. Conventions are as in Figure 7.
Figure 9.
Figure 9.
CB-ir in GPi. A, Photomicrographs of CB-immunoreactive staining in sections through the GPi. The section number is indicated above each photomicrograph. B, Procedure for unfolding GPi. See Materials and Methods for details. C, Gradient density maps of CB-ir for the outer and inner portions of GPi. The intensity of CB-ir is contoured into nine levels from the most intense staining (darkest) to the least intense staining (lightest), relative to the mean (0 level). The units are in SDs from the mean. The black arrows indicate the rostrocaudal level of the sections shown in A. IC, Internal capsule; PUT, putamen; GPii, inner portion of the GPi; GPio, outer portion of GPi; GPe, external segment of the globus pallidus; D, dorsal; M, medial; C, caudal.
Figure 10.
Figure 10.
Unfolded maps of the pallidal neurons that project to the SMA. The panels show unfolded maps of the distribution and density of second-order neurons that were labeled by retrograde transneuronal transport of virus from the SMA. The top row indicates labeling in GPio, and the bottom row shows labeling in GPii. The maps were generated from plots of every other coronal section through GPi. The colored squares are coded to indicate the number of labeled neurons in 200 μm bins throughout the nucleus (the color code is given in the bottom right corner of each panel). See Materials and Methods for the procedures used to unfold and chart the density of labeled neurons in GPi.
Figure 11.
Figure 11.
Unfolded maps of the pallidal neurons that project to the pre-SMA. The left and middle columns show unfolded maps of the distribution and density of second-order neurons that were labeled by retrograde transneuronal transport of virus from the pre-SMA. The top row indicates labeling in GPio, and the bottom row shows labeling in GPii. Conventions are as in Figure 10. The right column shows a gradient density map of CB-ir in GPi, overlaid with pallidal labeling after an injection into the pre-SMA (animal DA9R).
Figure 12.
Figure 12.
Summary map of the GPi output channels and their relationship to CB-ir. The location of known output channels in the dentate is overlaid on a map of CB-ir (from animal DA9R). The cortical target of the output channel is placed at the site of the peak labeling after retrograde transneuronal transport of virus from that cortical area. GPii, Inner portion of the GPi; GPio, outer portion of GPi.

Similar articles

Cited by

References

    1. Akkal D, Dum RP, Strick PL. Cerebellar and pallidal inputs to the supplementary motor area (SMA) Soc Neurosci Abstr. 2001;27:825–4. - PMC - PubMed
    1. Akkal D, Bioulac B, Audin J, Burbaud P. Comparison of neuronal activity in the rostral supplementary and cingulate motor areas during a task with cognitive and motor demands. Eur J Neurosci. 2002a;15:887–904. - PubMed
    1. Akkal D, Dum RP, Strick PL. Cerebellar and pallidal inputs to the pre-supplementary motor area (preSMA) Soc Neurosci Abstr. 2002b;28:462–14.
    1. Akkal D, Dum RP, Strick PL. Calbindin D-28K immunoreactivity reflects the topographic organization of motor and non-motor outputs channels in the globus pallidus. Soc Neurosci Abstr. 2003;29:601–4.
    1. Alexander GE, Crutcher MD. Preparation for movement: neural representations of intended direction in three motor areas of the monkey. J Neurophysiol. 1990;64:133–150. - PubMed

Publication types

LinkOut - more resources