. 2007 Oct 3;27(40):10722-33.
doi: 10.1523/JNEUROSCI.2479-07.2007.

Interactions between circadian neurons control temperature synchronization of Drosophila behavior

Affiliations

Interactions between circadian neurons control temperature synchronization of Drosophila behavior

Ania Busza et al. J Neurosci. .

Abstract

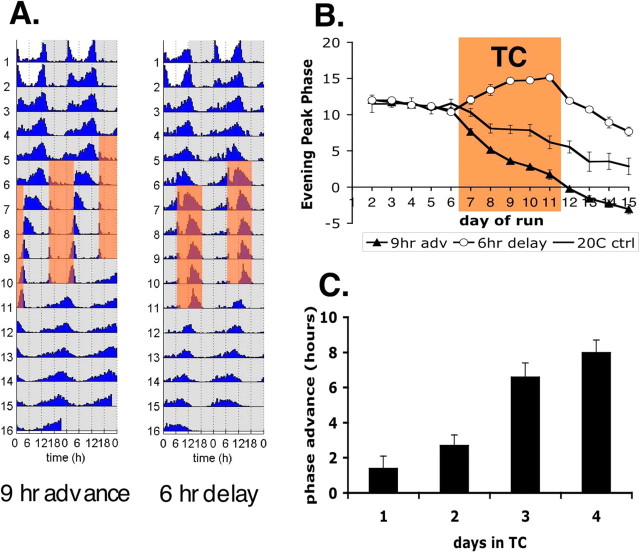
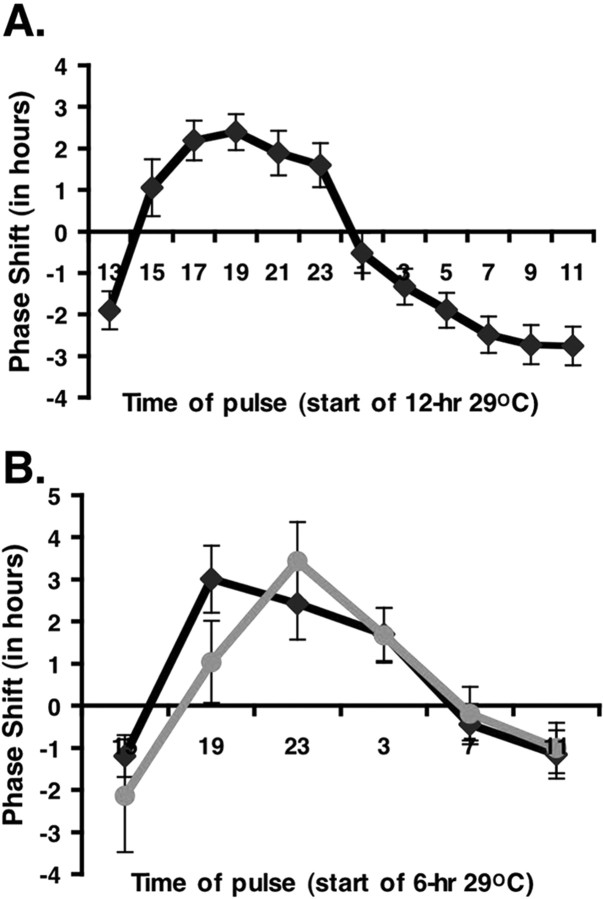
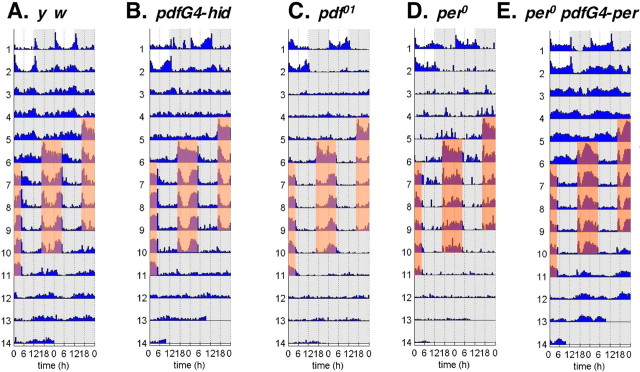
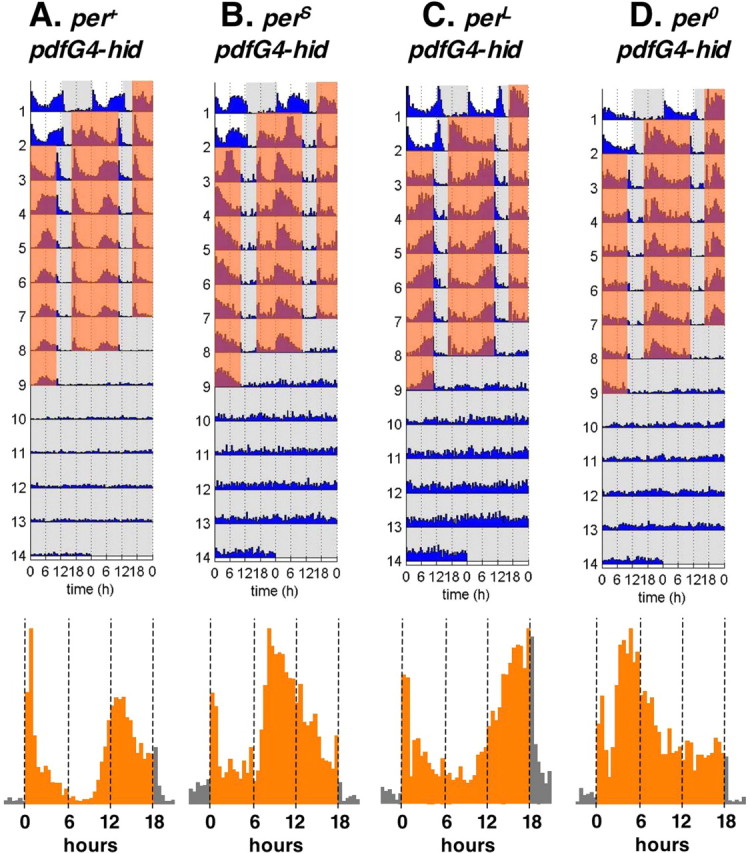
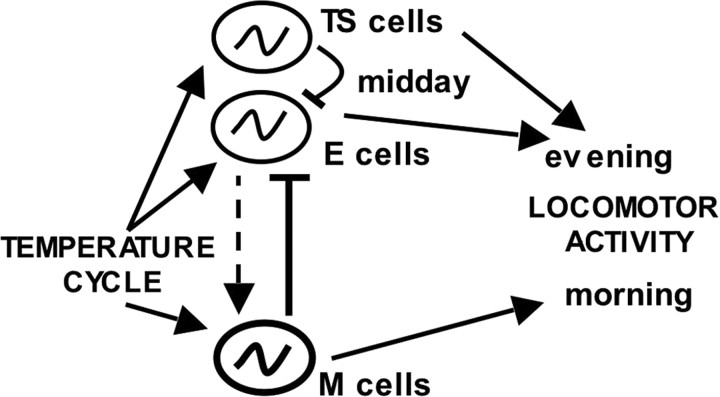
Most animals rely on circadian clocks to synchronize their physiology and behavior with the day/night cycle. Light and temperature are the major physical variables that can synchronize circadian rhythms. Although the effects of light on circadian behavior have been studied in detail in Drosophila, the neuronal mechanisms underlying temperature synchronization of circadian behavior have received less attention. Here, we show that temperature cycles synchronize and durably affect circadian behavior in Drosophila in the absence of light input. This synchronization depends on the well characterized and functionally coupled circadian neurons controlling the morning and evening activity under light/dark cycles: the M cells and E cells. However, circadian neurons distinct from the M and E cells are implicated in the control of rhythmic behavior specifically under temperature cycles. These additional neurons play a dual role: they promote evening activity and negatively regulate E cell function in the middle of the day. We also demonstrate that, although temperature synchronizes circadian behavior more slowly than light, this synchronization is considerably accelerated when the M cell oscillator is absent or genetically altered. Thus, whereas the E cells show great responsiveness to temperature input, the M cells and their robust self-sustained pacemaker act as a resistance to behavioral synchronization by temperature cycles. In conclusion, the behavioral responses to temperature input are determined by both the individual properties of specific groups of circadian neurons and their organization in a neural network.


Figures

Figure 1.
Figure 1.
Temperature is a Zeitgeber for Drosophila circadian behavior. A, Actograms showing the average locomotor behavior of groups of y w flies. Adult flies were exposed to 2 d of 12 h/12 h LD cycles at 20°C and then released into CC (darkness at 20°C) for 4 d. The flies were then exposed to 12 h/12 h 29°C/20°C TC cycles that were either advanced by 9 h (left; n = 16) or delayed by 6 h (right; n = 12) compared with the LD cycle. After 5 d in TC, the flies were released into CC. The light phase of the LD cycle is represented in white, and the dark phase is in gray. The warm phase of the TC cycle is shaded in orange, and the cold phase is in gray. B, Phase of the evening peak of locomotor activity during the temperature entrainment assay shown in A. The phase of the evening peak is plotted on the y-axis (0 corresponds to the lights-on transition of the LD cycle) for each day (x-axis). Flies not exposed to a TC (maintained in CC after day 2) were used as controls (20°C ctrl; n = 11). The difference in post-TC phase was maintained after release into constant conditions. The orange shading indicates the days during which the flies were exposed to TC. C, To determine the effect of TC cycles on the phase of the circadian oscillator underlying circadian behavior, the phase of free-running behavior was determined for wild-type flies (y w) after 1, 2, 3, or 4 d of exposure to an 8 h advanced TC (x-axis) and compared with the phase of flies left under constant conditions (for details, see Materials and Methods). The phase difference (y-axis) represents the magnitude of the phase shift induced by the TC on the endogenous circadian oscillator (number of rhythmic flies ranged from 10 to 13 per fly group; rhythmicity ranged from 73 to 93%).
Figure 2.
Figure 2.
Phase response curve to 12 and 6 h 29°C warm pulses. y w and cryb flies were synchronized to an LD cycle at 20°C and then exposed to 29°C for 6 or 12 h at different times of the night and the first subjective day. They were then kept in DD at 20°C to determine the phase of their locomotor behavior. A, y w flies (16–24 flies per time point) exposed to 12 h warm pulses. B, y w flies (black line; 9–15 flies per time point) and cryb flies (gray line; 12–16 flies per time point) exposed to 6 h warm pulses. x-Axis, Start time of the exposure to 29°C, in circadian time. y-Axis, Phase shift (in hours) of the evening peak relative to control flies not exposed to 29°C. Error bars indicate ±SEM.
Figure 3.
Figure 3.
The PDF+ M cells are necessary and sufficient for long-term synchronization of circadian behavior after exposure to temperature cycles. Flies with or without functional PDF+ cells were exposed to 2 d of 20°C LD, 4 d of CC, 5 d of 29°C/20°C TC (8 h advance), and then 3 d of CC. A, Wild-type controls (y w; +; +; n = 12). B, pdfG4-hid, Flies without M-cells (y w; pdf-GAL4/UAS-hid; +; n = 15). C, Flies missing the neuropeptide PDF (pdf01; n = 30). D, per0, Flies with a null mutation in the per gene (per0; n = 6). E, per0 pdfG4-hid, per0 flies with PER expression rescued only in the M cells (per0 w; pdf-GAL4/+; UAS-per/+; n = 16). Note the persistence of circadian rhythms after TC in flies with the M cells being the only functional circadian neurons (E). Circadian rhythms are not maintained when these cells are either absent (B) or do not produce PDF (C).
Figure 4.
Figure 4.
The evening peak is regulated by the circadian clock under TC. The M cells were genetically ablated in flies with short (perS), long (perL), or null (per0) per alleles. After 2 d of 20°C LD, the flies were exposed to a long thermophase/short cryophase TC (18 h at 29°C, 6 h at 20°C, with the start of the thermophase occurring 8 h earlier than the lights-on transition had been during LD). The phase of the M cell-independent evening peak is earlier in the perS background, later in the perL background, and very abnormal in the per0 background, demonstrating that it is under the control of the circadian clock. Average activity plots for the 3 last days in TC are shown under the actograms (orange bars, thermophase; dark gray bars, cryophase). A, y w; pdf-GAL4/UAS-hid; +; n = 14; mean phase, ZT13.8 ± 0.4. B, perS; pdf-GAL4/UAS-hid; +; n = 7; mean phase, ZT11.0 ± 0.4. C, perL; pdf-GAL4/UAS-hid; +; n = 12; mean phase, ZT16.5 ± 0.2. D, per0; pdf-GAL4/UAS-hid; +; n = 10; mean phase, ZT5.2 ± 0.4. ZT0 is at onset of thermophase, and mean phase refers to mean ZT of the evening (or afternoon) activity peak on the last day of TC ± SEM. Two-tailed t tests were performed comparing the phase of the evening peak in M cell ablated perS and perL flies with the phase of per+ ablated flies, and all differences were highly significant (p value <0.001).
Figure 5.
Figure 5.
Cell ablation and per0 rescue with the cry-GAL4 driver. A, Flies with ablated M and E cells (y w; UAS-hid/+; cry-GAL4/ +) were subjected to 5 d of TC cycle. At the time when PER staining is high (ZT21; right), the DNs and LPNs can be easily identified, but the LNvs and LNds are missing. It is likely that at least two DN1s are also ablated. At ZT9, no signal can be detected in any groups of cells. B, per0 flies with rescued PER expression in the M and E cells (per0 w; +; cry-GAL4/UAS-per) were also entrained to TC. At ZT21 (right), the LNvs, 2DN1s, and three to four LNds show strong PER signal that appears to be primarily nuclear. As expected, no PER staining was seen at ZT9 (left). Green, Anti-PDF staining; red, anti-PER staining. lLNvs, Large LNvs; sLNvs, small sLNvs.
Figure 6.
Figure 6.
The PDF-negative E cells control the evening peak during temperature cycles. Flies with or without functioning M and E cells were exposed to 2 d of 20°C LD, 6 d of 29°C/20°C TC (8 h advanced), and then 6 d of CC. Average activity plots for the 3 last days in TC are shown under the actograms (orange bars, thermophase; dark gray bars, cryophase). A, Wild-type flies (y w; n = 12; 67% rhythmicity after TC). B, Flies in which both the M and E cells were ablated (y w; cry-GAL4/UAS-hid; +; n = 16; no rhythmic flies after TC). C, Flies in which PER expression is limited to the M cells (per0 w; pdf-GAL4/+; UAS-per/+; n = 30; 55% rhythmicity after TC). D, Flies in which PER is only expressed in the M and E cells (per0 w; +; cry-GAL4/UAS-per; n = 25; 68% rhythmicity after TC). E, Flies in which PER is only expressed in the E cells (per0 w; pdf-GAL80/+; cry-GAL4/UAS-per; n = 32). The evening peak of activity cannot be detected when both the M and E cells are ablated (B) and is abnormally early when only the M cells have a functional clock (C; mean phase, ZT6.4 ± 0.3). When PER expression is rescued in both the M and E cells (D), evening activity is much more prominent once stable synchronization is reached, with a later peak phase than in flies with only the M cells being rescued (mean phase, ZT8.9 ± 0.4; p value <10−5). There is also more activity during the late subjective day under constant conditions. Thus, evening activity is restored under TC, although the onset of activity is still much earlier than in wild-type flies (A). Note that, during the first 2 d of synchronization to TC, per0 flies with rescued M and E cells (D) show transients with a much earlier phase than after 3 d. Experiments in which we released these flies under constant conditions after 1 or 2 d of entrainment revealed that, for unknown reasons, they progressively delay their rhythms rather than advancing them like wild-type flies, although the TC is advanced compared with the initial LD (data not shown). The data shown in E were obtained from a different experiment than those shown on A–D (additional actograms for this independent experiment are shown on supplemental Fig. S4, available at www.jneurosci.org as supplemental material).
Figure 7.
Figure 7.
Neurons other than the M and E cells contribute to the evening peak of activity under TC. A–D, The M and E cells were ablated using cry-GAL4 and UAS-hid in flies with different per alleles. per0, perS, and perL flies were first exposed to 12 h/12 h LD cycles and then to TC cycles with a 16 h thermophase and an 8 h cryophase. In the case of per+, the LD and TC cycles had a 16 h light phase and an 8 h dark phase (D). On the per+ actogram, stars indicate the evening peak when it is clearly visible. Number of flies were 8, 6, 10, and 23 for per0, perS, perL, and per+, respectively. No rhythmicity is observed after return to constant conditions. On the fourth day of TC, mean ± SEM phase of evening peak is ZT8.8 ± 0.7 for perS, ZT15.5 ± 0.7 for perL, and ZT12.0 ± 0.4 for per+ ablated flies. Two-tailed t tests were performed comparing the phase of the evening peak in ablated perS and perL flies with the phase of per+ ablated flies, and all differences were highly significant (p value <0.005). E, Average activity of per+ and per0 flies without M and E cells over 3 d of 16 h/8 h LD cycles (top graphs; gray bars, light phase; black bars, dark phase) and 6 d of 16 h/8 h TC cycles in DD (bottom graphs; orange bars, thermophase; black bars, cryophase). For similar plots with perS and perL flies without M and E cells, see supplemental Figure S5 (available at www.jneurosci.org as supplemental material). F, Average activity of per+ flies without M and E cells over 6 d of 16 h/8 h TC cycles in LL at two different light intensities (orange bars, thermophase; white bars, cryophase).
Figure 8.
Figure 8.
The E peak shows rapid synchronization in response to temperature cycles when the M cell oscillator is disrupted or genetically altered. A, Kinetics of synchronization of the cells that regulate the evening peak to TC in wild-type flies (y w; dashed line), pdf mutants (pdf01; solid line with open circles), and M cell ablated flies (y w; pdf-GAL4/UAS-hid; solid line with filled triangles). Flies were synchronized to 2 d LD and then exposed to 4 consecutive days of TC. The phase advance of the evening peak was calculated for each day in TC (in hours, relative to the phase in the last day of LD) and is plotted on the y-axis. x-Axis, Number of days under TC (day 0 corresponds to the last day of LD). Error bars indicate ±SEM. B, Kinetics of TC synchronization in wild-type flies (y w; dashed line) and flies with PER overexpression only in the M cells (y w; pdf-GAL4; UAS-per; solid line) in 4 d of TC (experiment and analysis same as in A). C, Kinetics of TC entrainment in wild-type flies (y w; black bars) and ClkJrk heterozygotes (y w; +; ClkJrk/+; gray bars). Because ClkJrk heterozygotes are highly active during the cryophase under TC, phase advances were measured by comparing the phase of the evening peak after release into constant conditions (20°C DD) in flies exposed to 1, 2, 3, or 4 d TC. y-Axis, Phase advance (in hours) relative to no TC control flies. x-Axis, Total number of days in TC before release in constant conditions. Error bars indicate ±SEM.
Figure 9.
Figure 9.
Model for the control of behavioral responses to temperature cycles by the circadian neuronal network. We have identified three groups of cells that contribute to behavioral responses to temperature entrainment: the M, E, and temperature-sensitive (TS) cells. Each group is represented by one oscillator-containing cell for simplicity. The three groups are sensitive to temperature, and they interact with each other to properly time circadian behavior in response to temperature cycles. The M cells have a robust pacemaker (shown in bold) that is relatively slow at responding to temperature cycles. Through rhythmic PDF secretion, the M cells slow down the response of the highly sensitive E cells. It is however likely that the E cells can also influence the M cells (dashed arrow), particularly in the presence of light (Stoleru et al., 2007). The combination of highly sensitive E cells and relatively resistant M cells is probably important for the balance between behavioral adaptability to temperature changes and resistance to random variations of temperature. In addition to the M–E cell interactions, the temperature-sensitive cells also interact with the E cells, inhibiting their behavioral output in the middle of the day.

Similar articles

Cited by

References

    1. Allada R, White NE, So WV, Hall JC, Rosbash M. A mutant Drosophila homolog of mammalian Clock disrupts circadian rhythms and transcription of period and timeless. Cell. 1998;93:791–804. - PubMed
    1. Boothroyd CE, Wijnen H, Naef F, Saez L, Young MW. Integration of light and temperature in the regulation of circadian gene expression in Drosophila. PLoS Genet. 2007;3:e54. - PMC - PubMed
    1. Brown SA, Zumbrunn G, Fleury-Olela F, Preitner N, Schibler U. Rhythms of mammalian body temperature can sustain peripheral circadian clocks. Curr Biol. 2002;17:1574–1583. - PubMed
    1. Bruce VG. Biological clocks. Cold Spring Harbor, NY: Cold Spring Harbor Laboratory; 1960. Environmental entrainment of circadian rhythms; pp. 29–86.
    1. Dunlap JC. Molecular bases for circadian clocks. Cell. 1999;96:271–290. - PubMed

Publication types

Substances

LinkOut - more resources