. 2007 Oct 3;27(40):10840-8.
doi: 10.1523/JNEUROSCI.1863-07.2007.

Breadth of tuning and taste coding in mammalian taste buds

Affiliations

Breadth of tuning and taste coding in mammalian taste buds

Seth M Tomchik et al. J Neurosci. .

Erratum in

  • J Neurosci. 2015 Jun 3;35(22):8683

Abstract

A longstanding question in taste research concerns taste coding and, in particular, how broadly are individual taste bud cells tuned to taste qualities (sweet, bitter, umami, salty, and sour). Taste bud cells express G-protein-coupled receptors for sweet, bitter, or umami tastes but not in combination. However, responses to multiple taste qualities have been recorded in individual taste cells. We and others have shown previously there are two classes of taste bud cells directly involved in gustatory signaling: "receptor" (type II) cells that detect and transduce sweet, bitter, and umami compounds, and "presynaptic" (type III) cells. We hypothesize that receptor cells transmit their signals to presynaptic cells. This communication between taste cells could represent a potential convergence of taste information in the taste bud, resulting in taste cells that would respond broadly to multiple taste stimuli. We tested this hypothesis using calcium imaging in a lingual slice preparation. Here, we show that receptor cells are indeed narrowly tuned: 82% responded to only one taste stimulus. In contrast, presynaptic cells are broadly tuned: 83% responded to two or more different taste qualities. Receptor cells responded to bitter, sweet, or umami stimuli but rarely to sour or salty stimuli. Presynaptic cells responded to all taste qualities, including sour and salty. These data further elaborate functional differences between receptor cells and presynaptic cells, provide strong evidence for communication within the taste bud, and resolve the paradox of broad taste cell tuning despite mutually exclusive receptor expression.


Figures

Figure 1.
Figure 1.
Representative taste cell responses (Ca2+ transients) to taste stimuli and to KCl depolarization. Tastants were applied focally to the taste pore and KCl was bath applied. Stimuli were presented in random order to avoid systematic errors. However, for clarity here and in the remaining figures, stimuli are shown in a common sequence. A, Responses from a presumptive receptor (type II) cell, as defined in Results. This cell responded to only one tastant, 30 μm cycloheximide (cyx), but did not respond to 200 μm denatonium (den), 500 mm sucrose (suc), 100 μm SC45647 (SC4), 200 mm MPG plus 1 mm IMP (MPG), 100 mm citric acid (cit), or 500 mm NaCl. The cell did not respond when depolarized with 50 mm KCl. B, Responses from a presumptive presynaptic (type III) cell. The cell responded to cyx, suc, SC4, MPG, cit, and NaCl. In addition, it responded when depolarized with 50 mm KCl (bath applied; note different timescale). The 20 s calibration bar applies to all tastant responses; the 100 s calibration bar applies only to KCl-evoked responses.
Figure 2.
Figure 2.
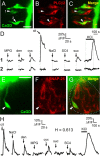
Post hoc immunostaining of lingual slices to identify receptor (type II) and presynaptic (type III) cells. Receptor cells are identified by the presence of PLCβ2 immunostaining and presynaptic cells by SNAP-25 immunopositivity. A–C, Confocal micrographs showing two adjacent taste buds in a lingual slice. A, Many cells are loaded with CaGD (green). B, After recording taste-evoked responses, the tissue was immunostained for PLCβ2 (red) to identify receptor cells. Arrowheads point to two tastant-responsive taste cells (1, 2). Cell 1 was PLCβ2 negative, whereas cell 2 (and several other cells in each taste bud) were immunoreactive for PLCβ2. C, Merged view. Scale bar, 20 μm. D, Calcium imaging traces of the taste cells highlighted in A–C. Cell 1 responded when depolarized with 50 mm KCl, demonstrating that it was a presynaptic cell. Cell 1 also responded broadly to taste stimuli, responding to denatonium (den), cycloheximide (cyx), citric acid (cit), and sucrose (suc). In contrast, cell 2 did not respond to KCl depolarization. Furthermore, cell 2 responded only to cycloheximide. The 20 s calibration bar applies to all taste responses; the 100 s calibration bar applies only to the KCl-evoked responses. E–G, Confocal micrographs showing a taste bud in a lingual slice immunostained for SNAP-25 (red) to identify presynaptic cells. The taste bud is outlined with a dotted white line in G. Scale bar, 20 μm. H, Calcium imaging of the taste cell identified (arrowhead) in E–G. This cell responded to KCl depolarization and to several taste stimuli, including citric acid, NaCl, denatonium, cycloheximide, and SC45647. The 20 s calibration bar applies to all tastant responses, and the 100 s calibration bar applies only to the KCl-evoked response. MPG, 200 mm monopotassium l-glutamate plus 1 mm IMP; den, 200 mm denatonium; cyx, 30 μm cycloheximide; cit, 100 mm citric acid; NaCl, 500 mm NaCl; SC4, 100 μm SC45647; suc, 500 mm sucrose; KCl, 50 mm KCl.
Figure 3.
Figure 3.
GFP identifies presynaptic (type III) cells in GAD–GFP mice. Confocal micrographs of 20 μm cryosections of vallate taste buds from GAD–GFP mice. A–C SNAP-25 immunostaining, showing immunolabel (red) in taste cells expressing GFP (green) and in nerve fibers. The merged image is shown in C. D, Higher magnification of one taste bud with merged SNAP-25 immunostaining and GFP fluorescence. Four cells in this taste bud expressed both GFP and SNAP-25; one cell expressed only SNAP-25 (arrowhead). E–G, 5-HT immunostaining (red). GFP (green) is expressed in many but not all serotonergic taste cells. H, Negative control, processed in parallel without primary antibodies, showing no detectable immunofluorescence (GFP fluorescence is not shown). The boundary of the epithelium containing taste cells is outlined; a micrograph using Nomarski differential contrast optics is overlaid on the left side only. I–K, PLCβ2 immunostaining (red). K, Merged image. Note that GFP (green) is not present in PLCβ2-immunoreactive taste cells. L, Quantification of results. Each set of three columns shows the percentage of taste cells expressing GAD–GFP only (green), immunostaining only (red) (SNAP-25, 5-HT, or PLCβ2), or the presence of both GAD–GFP fluorescence and immunostaining (yellow). IHC, Immunohistochemistry. Scale bars, 20 μm.
Figure 4.
Figure 4.
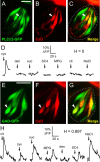
Calcium imaging in lingual slices from transgenic mice shows that receptor (type II) cells are narrowly responsive and presynaptic (type III) cells are broadly responsive to taste stimulation. A–C, Confocal micrographs of a vallate taste bud from a PLCβ2–GFP mouse. A, Many cells express PLCβ2–GFP (green). B, Some taste cells are loaded with the functional imaging dye, Calcium Orange (CaO) (red). The taste bud is outlined with a dotted line. C, Merged view. D, Responses of PLCβ2–GFP cell (i.e., receptor cell) shown in A–C (arrowhead). This cell responded only to cycloheximide. E–G, Confocal micrographs of a vallate taste bud from a GAD–GFP mouse. The taste bud is outlined in G. H, Responses of the GAD–GFP-positive (presynaptic) cell shown in E–G (arrowhead). This cell responded to citric acid, cycloheximide, sucrose, MPG, SC45647, and NaCl. Abbreviations as in Figure 2. Scale bars, 20 μm.
Figure 5.
Figure 5.
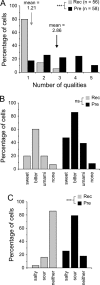
Summary of data from wild-type and transgenic mice showing range of taste responses in receptor and presynaptic taste cells. A, Percentage of receptor (Rec) and presynaptic (Pre) cells responding to one or more taste qualities (i.e., sweet, bitter, umami, sour, and salty). There was a significant difference in the incidences of responses to these taste qualities between receptor cells and presynaptic cells (Fisher's exact test, ***p < 0.001). B, Percentage of receptor and presynaptic cells responding to bitter, sweet, and umami taste qualities. There was no significant difference between receptor and presynaptic cells in the incidence of responses to these taste qualities (Fisher's exact test, p = 0.47; NS). C, Percentage of receptor and presynaptic cells that responded to sour and salty taste qualities. There was a significant difference between the proportion of receptor and presynaptic cells responding to these taste qualities (Fisher's exact test, ***p < 0.001).
Figure 6.
Figure 6.
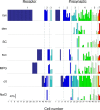
Ca2+ response profiles of receptor and presynaptic cells. Response magnitudes (mean peak ΔF/F) of each cell are shown. Each vertical column (top to bottom) represents data from an individual cell. Cells are numbered along axis at bottom and grouped into Receptor cells (left; n = 56) and presynaptic cells (right; n = 58). Each row shows responses for a different tastant (labeled at left). Within each of the two groups (receptor, presynaptic), cells are arranged according to their breadth of tuning and color coded accordingly (narrow to the left, cooler colors; more broadly responsive to the right, warmer colors). Response magnitudes are graphed as a percentage of the maximal response for a given cell. Numbers across the top and dotted lines indicate the number of taste stimuli to which each cell responded. The complete raw data are presented in supplemental Tables 1 and 2 (available at www.jneurosci.org as supplemental material). Abbreviations as in Figure 2.
Figure 7.
Figure 7.
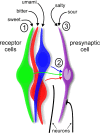
Schematic of gustatory processing based on data from the present study. 1, Receptor (type II) cells are narrowly tuned to sweet, bitter, or umami stimuli. 2, Signals from receptor cells converge onto presynaptic (type III) cells (orange) via purinergic cell–cell communication (cf. Huang et al., 2007). Consequently, presynaptic cells are more broadly responsive than receptor cells to sweet, bitter, and umami stimuli. 3, Furthermore, presynaptic cells also respond to sour and salty tastants, further increasing their breadth of tuning. Primary sensory afferent fibers receive purinergic excitation from receptor cells (Finger et al., 2005; Huang et al., 2007). Presynaptic cells release serotonin (Huang et al., 2007), possibly at the synapses they make with nerve fibers, the origin of which remains unspecified.

References

    1. Asada H, Kawamura Y, Maruyama K, Kume H, Ding RG, Kanbara N, Kuzume H, Sanbo M, Yagi T, Obata K. Cleft palate and decreased brain gamma-aminobutyric acid in mice lacking the 67-kDa isoform of glutamic acid decarboxylase. Proc Natl Acad Sci USA. 1997;94:6496–6499. - PMC - PubMed
    1. Caicedo A, Jafri MS, Roper SD. In situ Ca2+ imaging reveals neurotransmitter receptors for glutamate in taste receptor cells. J Neurosci. 2000;20:7978–7985. - PMC - PubMed
    1. Caicedo A, Kim KN, Roper SD. Individual mouse taste cells respond to multiple chemical stimuli. J Physiol (Lond) 2002;544:501–509. - PMC - PubMed
    1. Chandrashekar J, Hoon MA, Ryba NJ, Zuker CS. The receptors and cells for mammalian taste. Nature. 2006;444:288–294. - PubMed
    1. Chattopadhyaya B, Di Cristo G, Higashiyama H, Knott GW, Kuhlman SJ, Welker E, Huang ZJ. Experience and activity-dependent maturation of perisomatic GABAergic innervation in primary visual cortex during a postnatal critical period. J Neurosci. 2004;24:9598–9611. - PMC - PubMed

Publication types

MeSH terms

LinkOut - more resources