

Variability in responses and temporal coding of tastants of similar quality in the nucleus of the solitary tract of the rat
- PMID: 17913985
- PMCID: PMC2703738
- DOI: 10.1152/jn.00920.2007
Variability in responses and temporal coding of tastants of similar quality in the nucleus of the solitary tract of the rat
Abstract
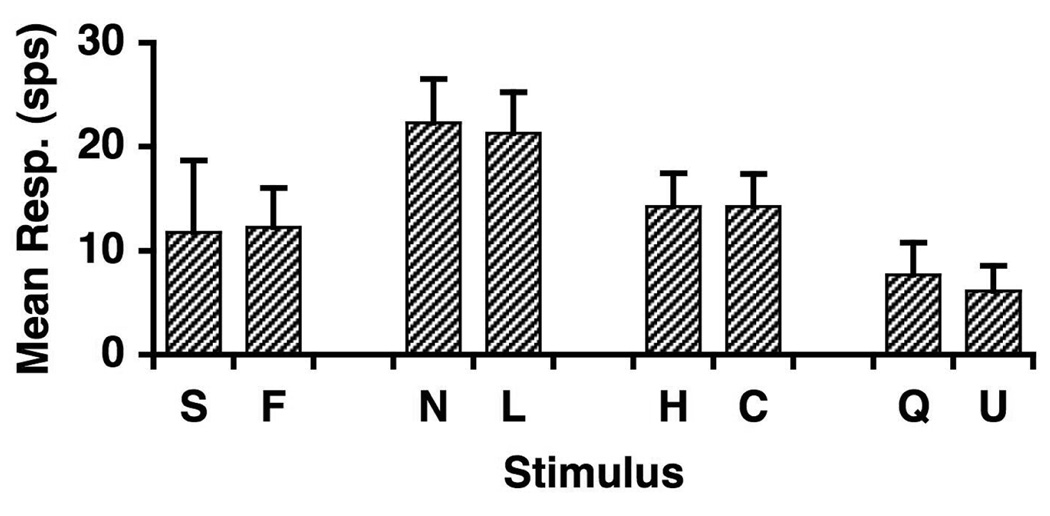
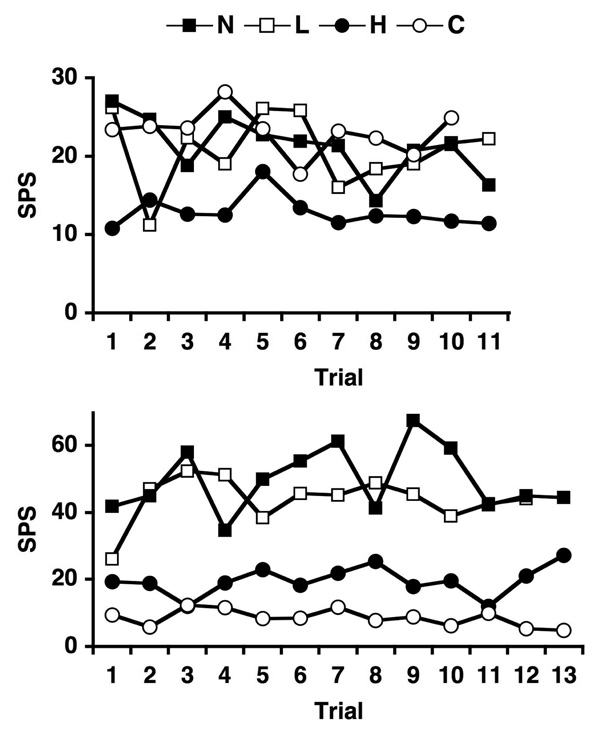
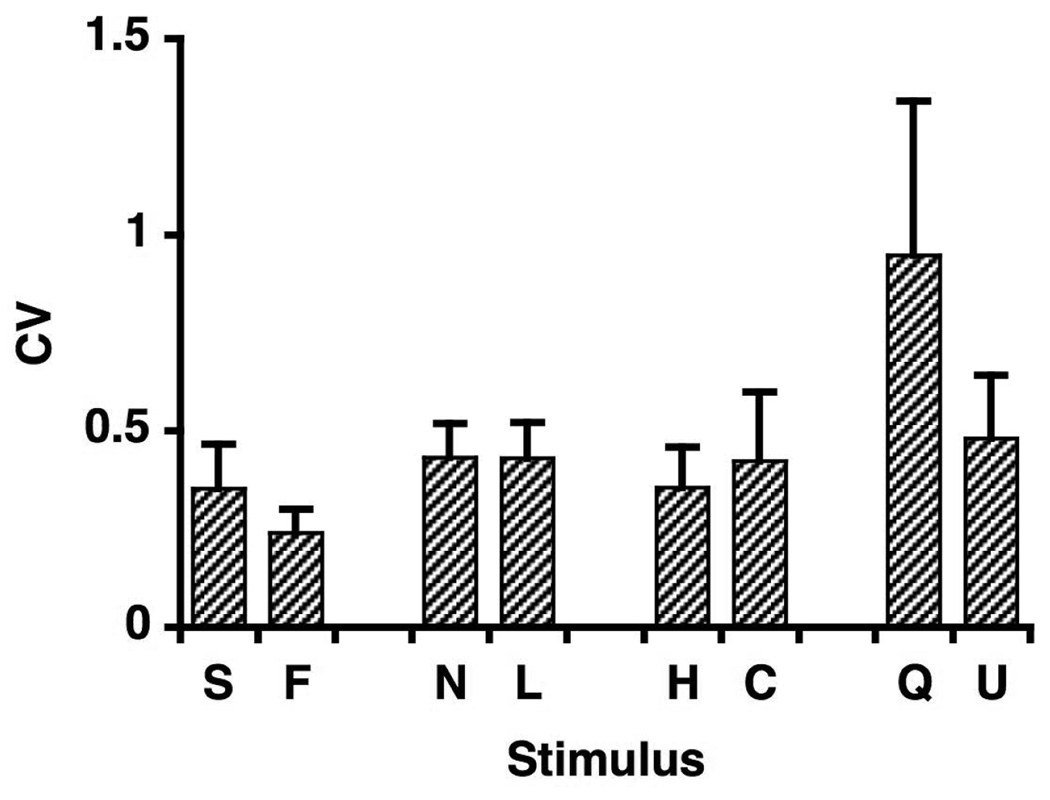
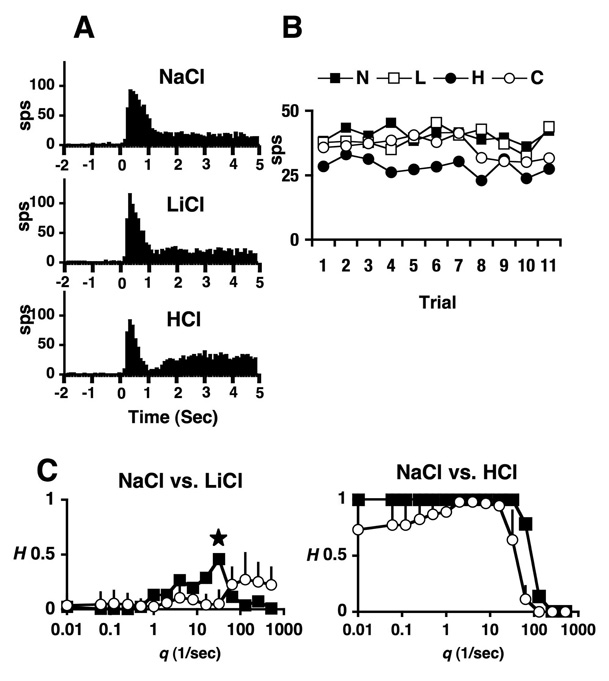
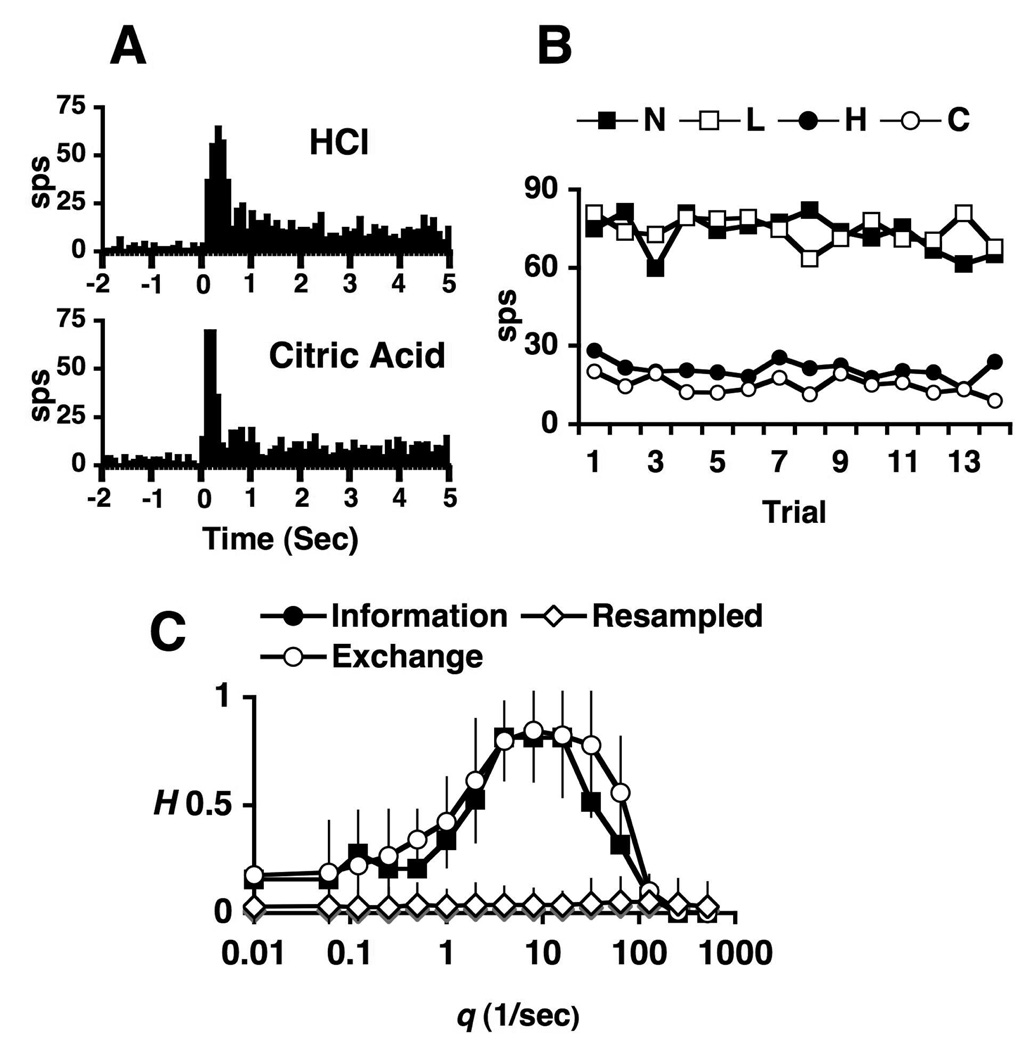
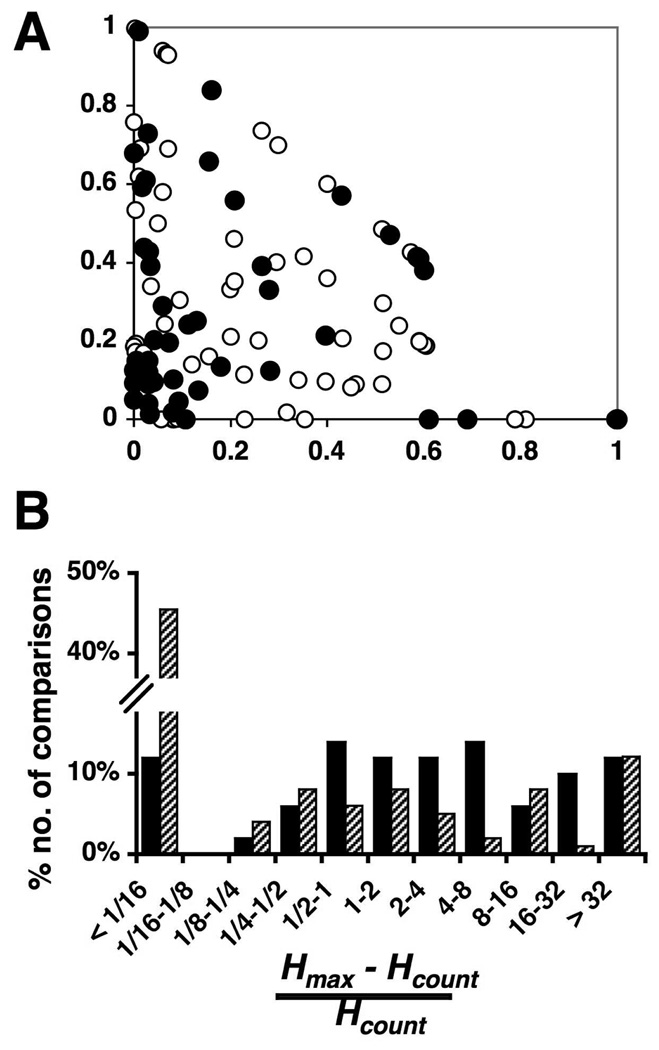
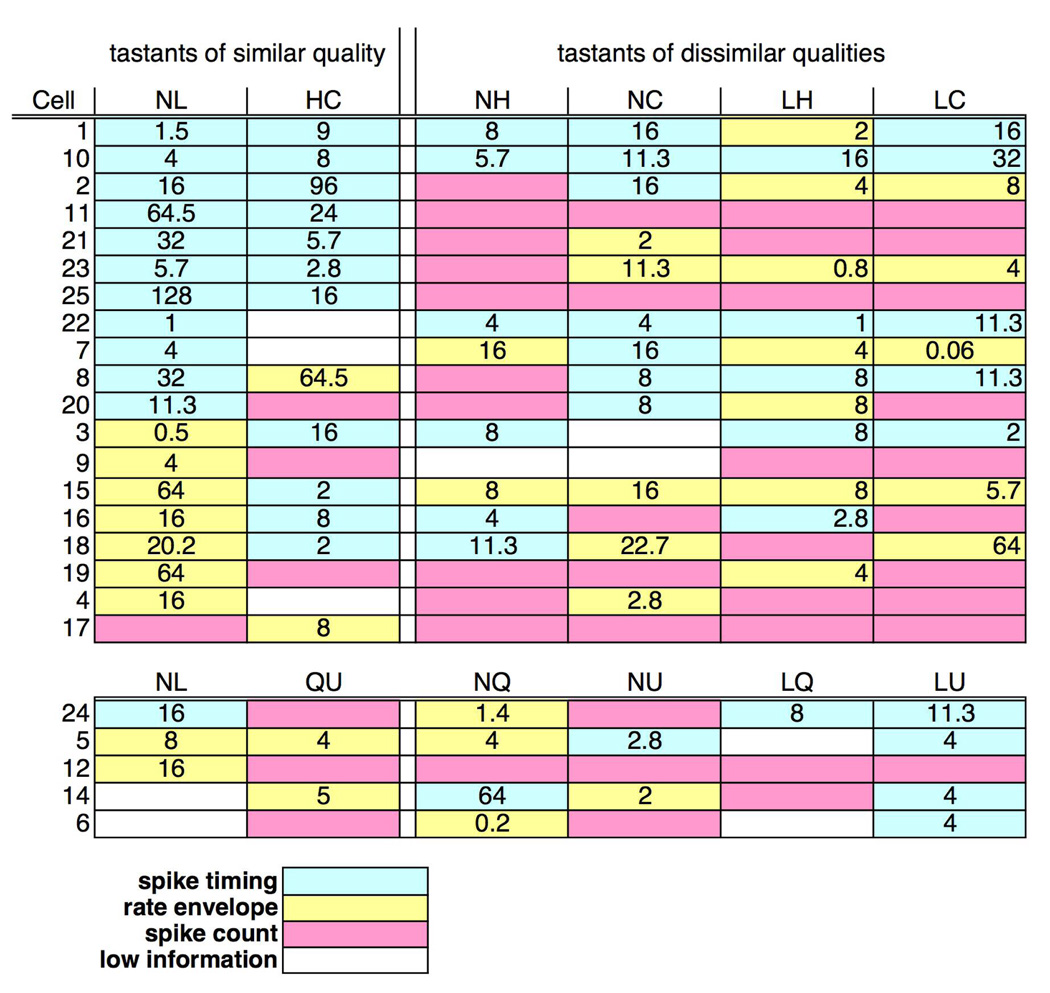
In the nucleus of the solitary tract (NTS), electrophysiological responses to taste stimuli representing four basic taste qualities (sweet, sour, salty, or bitter) can often be discriminated by spike count, although in units for which the number of spikes is variable across identical stimulus presentations, spike timing (i.e., temporal coding) can also support reliable discrimination. The present study examined the contribution of spike count and spike timing to the discrimination of stimuli that evoke the same taste quality but are of different chemical composition. Responses to between 3 and 21 repeated presentations of two pairs of quality-matched tastants were recorded from 38 single cells in the NTS of urethane-anesthetized rats. Temporal coding was assessed in 24 cells, most of which were tested with salty and sour tastants, using an information-theoretic approach. Within a given cell, responses to tastants of similar quality were generally closer in magnitude than responses to dissimilar tastants; however, tastants of similar quality often reversed their order of effectiveness across replicate sets of trials. Typically, discrimination between tastants of dissimilar qualities could be made by spike count. Responses to tastants of similar quality typically evoked more similar response magnitudes but were more frequently, and to a proportionally greater degree, distinguishable based on temporal information. Results showed that nearly every taste-responsive NTS cell has the capacity to generate temporal features in evoked spike trains that can be used to distinguish between stimuli of different qualities and chemical compositions.
Figures
Comment in
-
More time to taste. Focus on "variability in responses and temporal coding of tastants of similar quality in the nucleus of the solitary tract of the rat".J Neurophysiol. 2008 Feb;99(2):413-4. doi: 10.1152/jn.01285.2007. Epub 2007 Nov 28. J Neurophysiol. 2008. PMID: 18045997 No abstract available.
Similar articles
-
Taste coding in the nucleus of the solitary tract of the awake, freely licking rat.J Neurosci. 2012 Aug 1;32(31):10494-506. doi: 10.1523/JNEUROSCI.1856-12.2012. J Neurosci. 2012. PMID: 22855799 Free PMC article.
-
Taste response variability and temporal coding in the nucleus of the solitary tract of the rat.J Neurophysiol. 2003 Sep;90(3):1418-31. doi: 10.1152/jn.00177.2003. J Neurophysiol. 2003. PMID: 12966173
-
Effects of electrical stimulation of the chorda tympani nerve on taste responses in the nucleus of the solitary tract.J Neurophysiol. 2002 Nov;88(5):2477-89. doi: 10.1152/jn.00094.2002. J Neurophysiol. 2002. PMID: 12424287
-
Neural coding mechanisms for flow rate in taste-responsive cells in the nucleus of the solitary tract of the rat.J Neurophysiol. 2007 Feb;97(2):1857-61. doi: 10.1152/jn.00910.2006. Epub 2006 Dec 20. J Neurophysiol. 2007. PMID: 17182909 Free PMC article.
-
Temporal coding of intensity of NaCl and HCl in the nucleus of the solitary tract of the rat.J Neurophysiol. 2011 Feb;105(2):697-711. doi: 10.1152/jn.00539.2010. Epub 2010 Nov 24. J Neurophysiol. 2011. PMID: 21106899 Free PMC article.
Cited by
-
Temporal characteristics of gustatory responses in rat parabrachial neurons vary by stimulus and chemosensitive neuron type.PLoS One. 2013 Oct 4;8(10):e76828. doi: 10.1371/journal.pone.0076828. eCollection 2013. PLoS One. 2013. PMID: 24124597 Free PMC article.
-
A diversity of synaptic filters are created by temporal summation of excitation and inhibition.J Neurosci. 2011 Oct 12;31(41):14721-34. doi: 10.1523/JNEUROSCI.1424-11.2011. J Neurosci. 2011. PMID: 21994388 Free PMC article.
-
18-Methoxycoronaridine, a potential anti-obesity agent, does not produce a conditioned taste aversion in rats.Pharmacol Biochem Behav. 2010 Sep;96(3):247-50. doi: 10.1016/j.pbb.2010.05.002. Epub 2010 May 10. Pharmacol Biochem Behav. 2010. PMID: 20457177 Free PMC article.
-
Neural Coding of Food Is a Multisensory, Sensorimotor Function.Nutrients. 2021 Jan 27;13(2):398. doi: 10.3390/nu13020398. Nutrients. 2021. PMID: 33513918 Free PMC article. Review.
-
Recognizing Taste: Coding Patterns Along the Neural Axis in Mammals.Chem Senses. 2019 Apr 15;44(4):237-247. doi: 10.1093/chemse/bjz013. Chem Senses. 2019. PMID: 30788507 Free PMC article. Review.
References
-
- Balagura S, Smith DF. Role of LiCl and environmental stimuli on generalized learned aversion to NaCl in the rat. Am J Physiol. 1970;219:1231–1234. - PubMed
-
- Bradley RM, Stedman HM, Mistretta CM. Superior laryngeal nerve response patterns to chemical stimulation of sheep epiglottis. Brain Res. 1983;276:81–93. - PubMed
-
- Chandrashekar J, Mueller KL, Hoon MA, Adler E, Feng L, Guo W, Zuker CS, Ryba NJ. T2Rs function as bitter taste receptors. Cell. 2000;100:703–711. - PubMed
-
- Di Lorenzo PM. The neural code for taste in the brain stem: Response profiles. Physiology & Behavior. 2000;69(1–2):87–96. - PubMed
Publication types
MeSH terms
Substances
Grants and funding
LinkOut - more resources
Full Text Sources