. 2007 Dec;18(12):4921-31.
doi: 10.1091/mbc.e07-04-0392. Epub 2007 Oct 3.

AP-1 and ARF1 control endosomal dynamics at sites of FcR mediated phagocytosis

Affiliations

AP-1 and ARF1 control endosomal dynamics at sites of FcR mediated phagocytosis

Virginie Braun et al. Mol Biol Cell. 2007 Dec.

Abstract

Phagocytosis, the mechanism of ingestion of large material and microorganisms, relies on actin polymerization and on the focal delivery of intracellular endocytic compartments. The molecular mechanisms involved in the formation and delivery of the endocytic vesicles that are recruited at sites of phagocytosis are not well characterized. Here we show that adaptor protein (AP)-1 but not AP-2 clathrin adaptor complexes are recruited early below the sites of particle attachment and are required for efficient receptor-mediated phagocytosis in murine macrophages. Clathrin, however, is not recruited with the AP complexes. We further show that the recruitment of AP-1-positive structures at sites of phagocytosis is regulated by the GTP-binding protein ARF1 but is not sensitive to brefeldin A. Furthermore, AP-1 depletion leads to increased surface levels of TNF-alpha, a cargo known to traffic through the endosomes to the plasma membrane upon stimulation of the macrophages. Together, our results support a clathrin-independent role for AP complexes in endosomal dynamics in macrophages by retaining some cargo proteins, a process important for membrane remodeling during phagocytosis.


Figures

Figure 1.
Figure 1.
AP-1 is recruited at sites of FcR-mediated phagocytosis but AP-2 is not. (A) RAW264.7 cells were incubated for 3 min with IgG-SRBCs, fixed, and stained with Cy2-anti-rabbit IgG to reveal external SRBCs (middle panels). The cells were then permeabilized and labeled with anti-γ-adaptin (top panels) or anti-α-adaptin (bottom panels) followed by Cy3-anti-mouse IgG to detect AP-1 and -2 complexes, respectively (left panels). Polymerized actin was labeled with Alexa350-phalloidin (right panels). Cells were analyzed by wide-field microscopy with deconvolution. Medial optical sections are shown. Bar, 5 μm. (B) The number of accumulations of γ-adaptin and F-actin in nascent phagosomes was scored for 50 cells randomly chosen on coverslips. Results are expressed as percentage and are the mean ± SEM of three independent experiments. Differences between F-actin and AP-1 accumulations were not significant (p > 0.05).
Figure 2.
Figure 2.
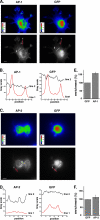
Quantitation of AP-1 enrichment at the phagocytic sites. (A) pEGFP transfected RAW264.7 cells were incubated for 3 min at 37°C with IgG-SRBCs, then fixed, permeabilized, and stained with anti-γ-adaptin (AP-1; left panels) followed by Cy3-anti-mouse F(ab′)2 and Alexa350-phalloidin to detect phagocytic sites (not shown). GFP fluorescence is shown in the right panels. Images are shown using the Rainbow2 (top panels) or Grayscale (bottom panels) look-up table. Values on the color scales in the left corners of the top panels indicate the fluorescence intensities. Scale bar, 5 μm. (B) The profiles of γ-adaptin (left) and GFP (right) fluorescence intensities along the lines drawn at the phagocytic site (line 1) and in the cell body (line 2) are shown. (C) As described in A, except that GFP-expressing RAW264.7 cells were stained for α-adaptin (AP-2) after incubation for 3 min at 37°C with IgG-SRBCs (left panels). GFP fluorescence is shown in the right panels. A section on the dorsal side of the cells has been analyzed to better detect AP-2 staining at the plasma membrane. (D) The profiles of α-adaptin (left) and GFP (right) fluorescence intensities along the lines drawn at the phagocytic site (line 1) and in the cell body (line 2) are shown. (E and F) The fluorescence intensities measured in the phagocytic cups were background subtracted and expressed as a percentage of the fluorescence intensities in the cell body. Data obtained for γ-adaptin (E) or for α-adaptin (F) were compared with and expressed as a percentage of values obtained for GFP in the same regions of interest. Data are the mean + SEM of 15 independent measurements. Accumulation of AP-1 at phagocytic sites was significantly higher than that of GFP (p < 0.0001), but AP-2 was not enriched in nascent phagosomes as compared with GFP (p > 0.1).
Figure 3.
Figure 3.
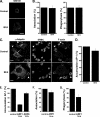
γ-adaptin is required for efficient FcR-mediated phagocytosis. (A) RAW264.7 cells were transfected either with γ-adaptin siRNA (AP-1) or with a nonspecific control siRNA (c). Twenty-four hours after transfection, cell lysates were analyzed by Western blot to detect γ-adaptin (bottom panel) and clathrin heavy chain (top panel). (B) γ-adaptin–depleted cells were incubated for 60 min at 37°C with IgG-SRBCs, then fixed, and stained with Cy2-anti-rabbit IgG to detect external SRBCs. The efficiencies of association (left) and phagocytosis (right) were calculated as described in Material and Methods in 50 γ-adaptin–depleted (AP-1) or control siRNA-treated cells (control). Results are expressed as a percentage of control cells. The means ± SEM of three independent experiments are plotted. Particle association (p < 0.05) and phagocytosis (p < 0.005) were significantly different between control siRNA- and AP-1-siRNA–treated cells.
Figure 4.
Figure 4.
Recruitment of γ-adaptin at sites of phagocytosis is BFA-insensitive and controlled by ARF1. (A) RAW264.7 cells were incubated in the presence BFA (bottom panel) at 10 μg/ml or the equivalent volume of methanol (top panel) for 30 min at 37°C, fixed, and stained with an anti-GM130 antibody followed by Cy3 anti-mouse-IgG. Cells were analyzed by wide-field microscopy with deconvolution. Medial optical sections are shown. Bar, 5 μm. (B) Cells pretreated or not with BFA were incubated for 60 min at 37°C with IgG-SRBCs, then fixed, and stained with Cy2-anti-rabbit IgG. The efficiencies of association (left) and phagocytosis (right) were determined as described in Figure 2. The means ± SEM of three independent experiments are plotted. (C) γ-adaptin recruitment during phagocytosis was evaluated in the presence of brefeldin A (BFA, bottom panels) or in the presence of the equivalent volume of methanol (control, top panels). RAW264.7 cells were fixed after 3 min of contact with IgG-SRBCs and stained with Cy2 anti-rabbit IgG to detect external SRBCs (middle panels). The cells were then permeabilized and labeled with anti-γ-adaptin followed by Cy3 anti-mouse IgG (left panels) and Alexa350-phalloidin (right panels). Cells were analyzed by wide-field microscopy with deconvolution. Medial optical sections are shown. γ-adaptin exhibits a perinuclear localization in control cells (arrow), which is lost in BFA-treated cells. By contrast, γ-adaptin is enriched in phagocytic cups (arrowheads) in control as well as in BFA-treated cells. Bar, 5 μm. (D) BFA-treated and control cells were scored for γ-adaptin accumulations around bound particles. Results are expressed as a percentage of control cells. Means ± SEM of n = 7 independent experiments are plotted. (E) RAW264.7 cells transiently transfected to express ARF1T31N or ARF6T26N were incubated with IgG-SRBCs for 3 min at 37°C. Accumulation of γ-adaptin at sites of particles attachment was scored in 50 ARF1T31N-positive cells or 50 ARF6T26N-positive cells as well as 50 negative control cells on the same coverslips. Results are expressed as a percentage of control cells. Means ± SEM of n = 6 independent experiments are plotted. Both ARF1T31N and ARF6T26N significantly inhibited AP-1 accumulations at phagocytic sites (p < 0.005). (F and G) RAW264.7 cells transfected with ARF1T31N were incubated for 60 min at 37°C with IgG-SRBCs, then fixed, and stained with Cy2-anti-rabbit F(ab′)2 to detect external SRBCs. The efficiencies of association (F) and phagocytosis (G) were calculated as described in Material and Methods in 50 transfected or control cells (control). Results are expressed as a percentage of control cells. The means ± SEM are the result of four independent experiments. ARF1T31N significantly inhibited phagocytosis (p < 0.05) but not association of particles (p > 0.05).
Figure 5.
Figure 5.
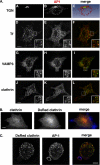
Colocalization of AP-1 with subcellular markers in RAW264.7 macrophages. (A) When indicated, RAW264.7 cells were incubated with Alexa488-coupled transferrin internalized for 10 min at 37°C (D–F) or transiently transfected to express GFP-VAMP3 (G–I). The cells were then fixed and stained with anti-γ-adaptin followed by Cy3 anti-mouse IgG (B, E, H, and K) together with anti-TGN (A) or anti-clathrin (J) antibodies. Cells were analyzed by wide-field microscopy with deconvolution. Medial optical sections are shown. Combined images are presented (C, F, I, and L). Insets are shown in D–L. Images were converted numerically using the AMIRA software to calculate the volume rending and visualize the colocalization between the TGN (green) and γ -adaptin (red; C). Bar, 5 μm. (B) RAW264.7 cells transiently expressing clathrin-DsRed were incubated for 3 min with IgG-SRBCs, fixed, permeabilized, and labeled with anti-clathrin heavy chain followed by Cy2 anti-mouse F(ab′)2 (green in merged image) and Alexa350-phalloidin (blue in merged image) to detect polymerized actin at phagocytic sites. Cells were analyzed by wide-field microscopy with deconvolution. Combined image (right panel) shows no recruitment of clathrin at phagocytic sites. Bar, 5 μm. (C) RAW264.7 cells transiently expressing Clathrin-DsRed were incubated for 3 min with IgG-SRBCs (blue in merge), fixed, permeabilized, and labeled with anti-γ-adaptin followed by Cy3 anti-mouse F(ab′)2 to detect AP-1 complexes (middle panel, red in merge). Cells were analyzed by wide-field microscopy with deconvolution. Although AP-1 is recruited in the phagocytic site, clathrin is not, as shown in combined image (right panel). Bar, 5 μm.
Figure 6.
Figure 6.
AP-1 is cleaved in macrophages, and its depletion leads to increased surface detection of TNF-α. (A) HeLa cells, RAW264.7 macrophages and freshly isolated human monocytes were lysed, immunoprecipitated with anti-γ-adaptin antibody, run onto SDS-PAGE, and analyzed by Western blotting with anti-γ-adaptin antibodies. For HeLa and RAW264.7 cells an aliquot of the total cell lysate was also analyzed. (B) RAW264.7 cells were incubated with Alexa633-coupled transferrin internalized for 30 min at 37°C. The cells were then fixed, permeabilized, and stained with anti-γ-adaptin and anti-TNF-α followed, respectively, by Cy3 anti-mouse F(ab′)2 and Cy2 anti-rat F(ab′)2. Cells were analyzed by wide-field microscope with deconvolution. A Z projection of eight planes is shown. Bar, 5 μm. (C) Surface TNF-α was detected by flow cytometry in AP-1–depleted cells (thin line) and compared with control siRNA-depleted cells (bold line). Cells stained with the secondary antibodies alone were used as a control (dotted line). (D) Mean fluorescence intensities of surface TNF-α detection in AP-1–depleted cells were expressed as a percentage of control siRNA-depleted cells. Data are the means ± SEM of four experiments. Depletion of AP-1 lead to a significant increase in the surface TNF-α on macrophages compared with control siRNA-treated cells (p < 0.0005).
Figure 7.
Figure 7.
Schematic representation of the possible role of adaptors during phagocytosis. This model proposes that AP-1 complexes exist as two pools in macrophages. The uncleaved proteins would be recruited on Golgi membranes after activation of ARF1 by a BFA-sensitive GEF, whereas the cleaved proteins would be recruited on endosomal membranes close to sites of particle attachment after activation of ARF1 by a BFA-insensitive GEF. In addition, no clathrin is associated with the AP-1 complexes in the cytoplasm under the sites of phagosome formation. The cleaved complexes without clathrin would help segregate proteins away from recycling to the plasma membrane during phagocytosis, a process that is necessary for phagocytosis to be efficiently completed. ARF6 would be important for later steps of VAMP3-dependent membrane fusion and pseudopod extension.

Similar articles

Cited by

References

    1. Aderem A. How to eat something bigger than your head. Cell. 2002;110:5–8. - PubMed
    1. Aderem A., Underhill D. M. Mechanisms of phagocytosis in macrophages. Annu. Rev. Immunol. 1999;17:593–623. - PubMed
    1. Aggeler J., Werb Z. Initial events during phagocytosis by macrophages viewed from outside and inside the cell: membrane-particle interactions and clathrin. J. Cell Biol. 1982;94:613–623. - PMC - PubMed
    1. Araki N., Hatae T., Furukawa A., Swanson J. A. Phosphoinositide-3-kinase-independent contractile activities associated with Fcgamma-receptor-mediated phagocytosis and macropinocytosis in macrophages. J. Cell Sci. 2003;116:247–257. - PubMed
    1. Austin C. D., et al. Death-receptor activation halts clathrin-dependent endocytosis. Proc. Natl. Acad. Sci. USA. 2006;103:10283–10288. - PMC - PubMed

Publication types