. 2007 Oct 2;5(10):e259.
doi: 10.1371/journal.pbio.0050259.

Relationship between mitochondrial electron transport chain dysfunction, development, and life extension in Caenorhabditis elegans

Affiliations

Relationship between mitochondrial electron transport chain dysfunction, development, and life extension in Caenorhabditis elegans

Shane L Rea et al. PLoS Biol. .

Erratum in

  • PLoS Biol. 2008 Jan;6(1):e23
  • PLoS Biol. 2008 Mar;6(3):e78
  • PLoS Biol. 2008 May;6(5):e136

Abstract

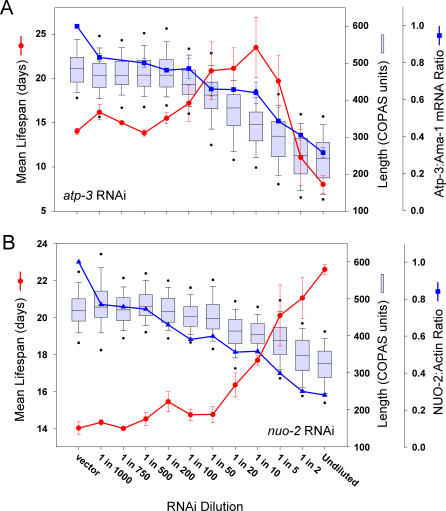
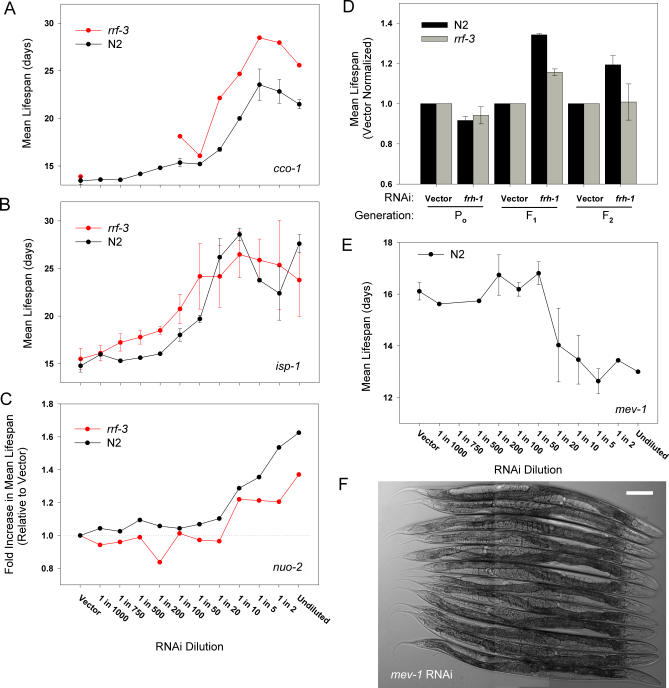
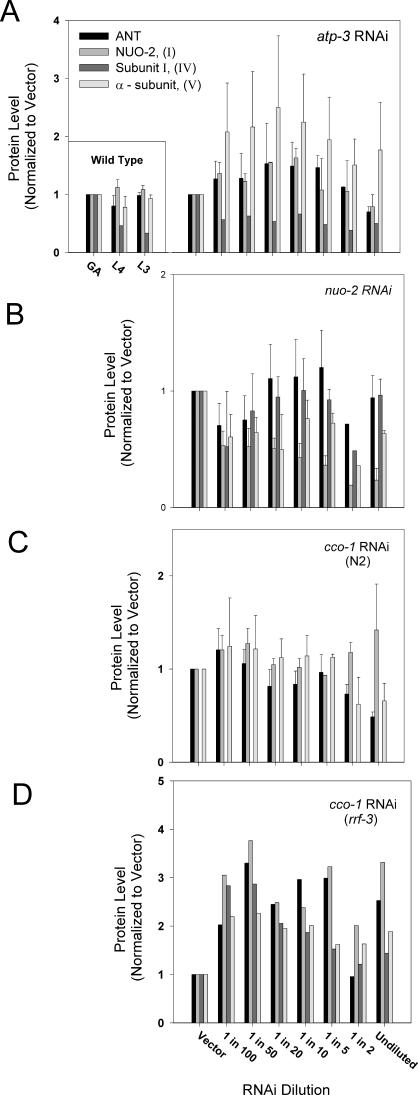
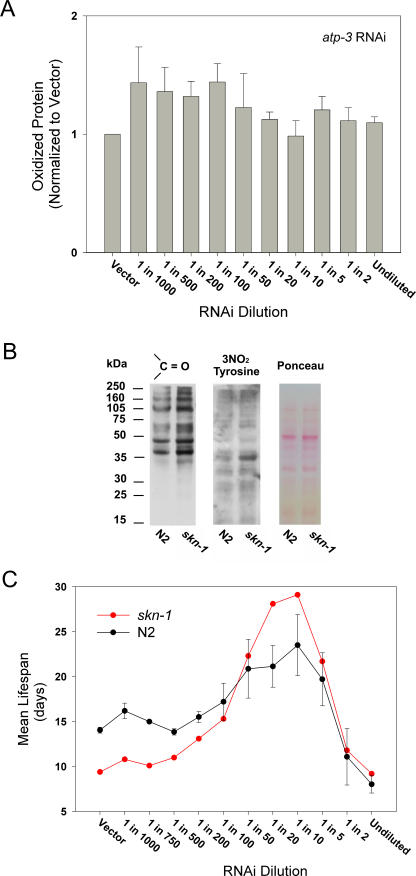
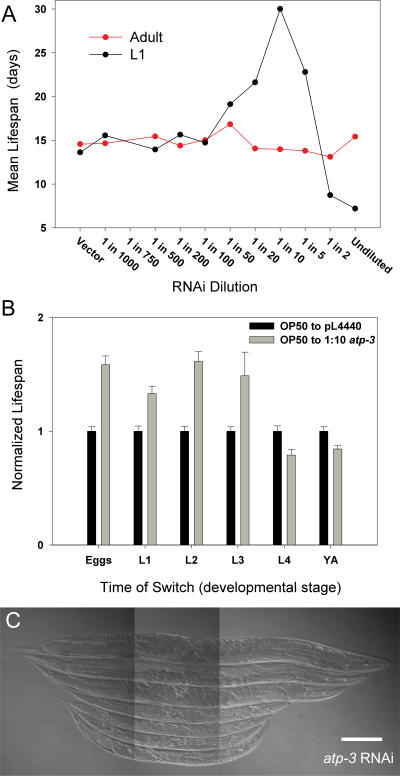
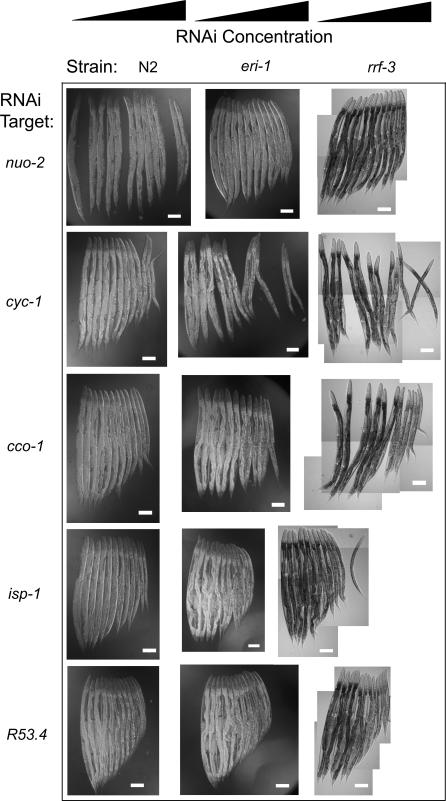
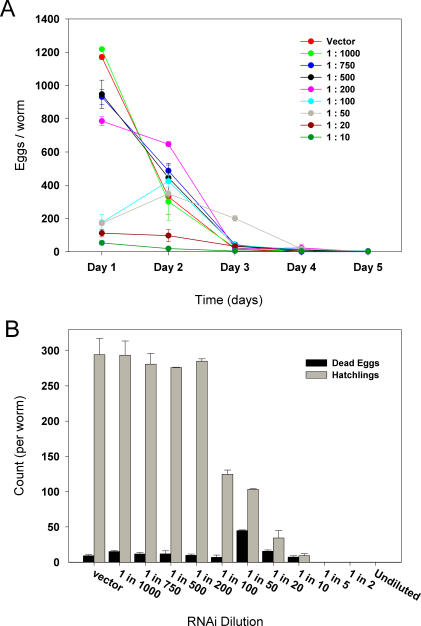
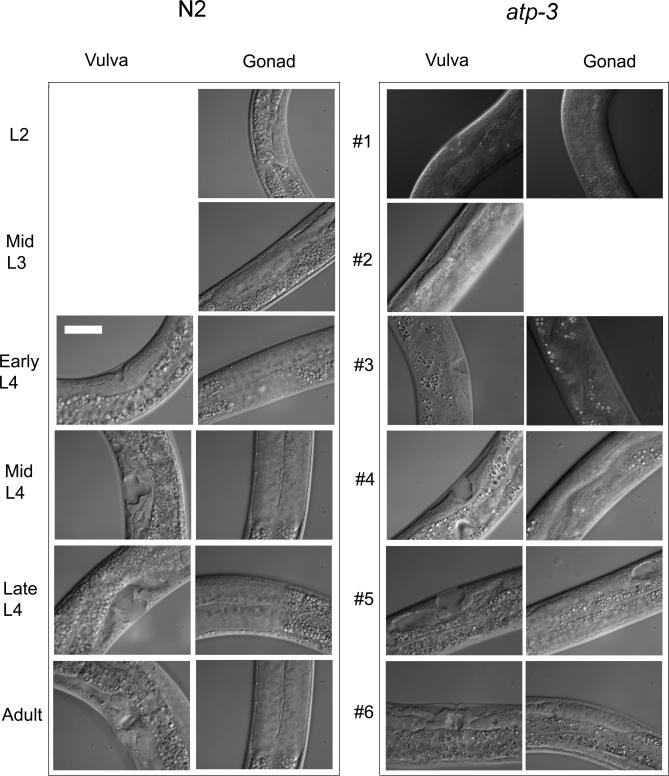
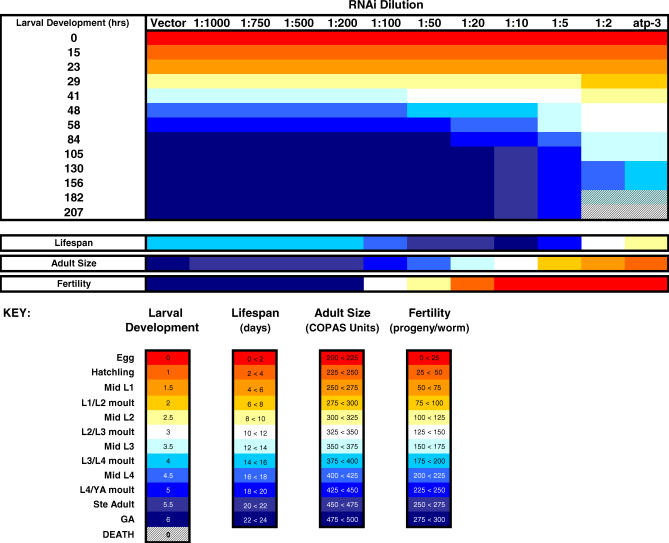
Prior studies have shown that disruption of mitochondrial electron transport chain (ETC) function in the nematode Caenorhabditis elegans can result in life extension. Counter to these findings, many mutations that disrupt ETC function in humans are known to be pathologically life-shortening. In this study, we have undertaken the first formal investigation of the role of partial mitochondrial ETC inhibition and its contribution to the life-extension phenotype of C. elegans. We have developed a novel RNA interference (RNAi) dilution strategy to incrementally reduce the expression level of five genes encoding mitochondrial proteins in C. elegans: atp-3, nuo-2, isp-1, cco-1, and frataxin (frh-1). We observed that each RNAi treatment led to marked alterations in multiple ETC components. Using this dilution technique, we observed a consistent, three-phase lifespan response to increasingly greater inhibition by RNAi: at low levels of inhibition, there was no response, then as inhibition increased, lifespan responded by monotonically lengthening. Finally, at the highest levels of RNAi inhibition, lifespan began to shorten. Indirect measurements of whole-animal oxidative stress showed no correlation with life extension. Instead, larval development, fertility, and adult size all became coordinately affected at the same point at which lifespan began to increase. We show that a specific signal, initiated during the L3/L4 larval stage of development, is sufficient for initiating mitochondrial dysfunction-dependent life extension in C. elegans. This stage of development is characterized by the last somatic cell divisions normally undertaken by C. elegans and also by massive mitochondrial DNA expansion. The coordinate effects of mitochondrial dysfunction on several cell cycle-dependent phenotypes, coupled with recent findings directly linking cell cycle progression with mitochondrial activity in C. elegans, lead us to propose that cell cycle checkpoint control plays a key role in specifying longevity of mitochondrial mutants.


Conflict of interest statement

Competing interests. The authors have declared that no competing interests exist.

Figures

Figure 1
Figure 1. Effect of Increasing ETC Impairment on the Lifespan of atp-3 and nuo-2 Mit Mutants
RNAi dilution series for atp-3 (A) and nuo-2 (B) were established using N2. Adult length (box plots in [A] and [B] show median [line], 10th–90th percentile [whiskers] and 5th–95th percentile [black dots]), mean adult longevity (± standard error of the mean [SEM], red line with circles), and total atp-3 mRNA content (±SEM, blue line with squares), or NUO-2 protein level (blue line with triangles) were assessed for worms at each RNAi dilution (see Figure S1 for decomposition of averaged data). All animals reached adulthood except those on undiluted atp-3 RNAi (see Figure 9). At an RNAi dilution of 1:50 for atp-3, and 1:20 for nuo-2, mean lifespan began to increase significantly (p < 0.05). Adult length is specified in linear COPAS units, and 500 COPAS units approximates 1 mm.
Figure 2
Figure 2. A Threshold Effect Differentially Modulates Adult Lifespan in cco-1, isp-1, nuo-2, frh-1, and mev-1 Mitochondrial Mutants
(A, B, and C) RNAi dilution series for cco-1 (A), isp-1 (B), and nuo-2 (C) were established using N2 (black lines). Adult lifespan increases significantly (p < 0.05) for cco-1, isp-1, and nuo-2 at RNAi dilutions of 1:200, 1:50, and 1:20, respectively. Lifespan noticeably peaks for cco-1 and isp-1 at dilutions of 1:10 and 1:5, respectively. The RNAi-enhancing rrf-3(pk1426) mutation (red lines) caused almost no alteration in the threshold for life extension within each RNAi dilution series. (Data are the average of at least two independent experiments ± SEM). (D) Wild-type (N2) and rrf-3(pk1426) mutant animals were cultured for three consecutive generations on bacteria expressing frh-1 or control (vector) RNAi. Lifespan analysis of synchronous parental (Po), and filial (F1 and F2) populations was undertaken in duplicate for each condition (n = 60 worms/condition). Data for each strain, at each generation, are normalized relative to the respective vector condition. (E) A mev-1 RNAi dilution series was established using N2 animals (n = 60 worms/condition). A significant life-shortening effect beginning at a dilution of 1:20 is apparent (p = 6.6 × 10⁻¹³). (F) Nomarski images of randomly selected 1-d-old animals from a mev-1 RNAi dilution series (400×): top to bottom (target gene to empty vector ratio), 0:1, 1:1,000, 1:750, 1:500, 1:200, 1:100, 1:50, 1:20, 1:10, 1:5, 1:2, and 1:0. No size reduction at any dilution is evident) Scale bar indicates 100 μm.
Figure 3
Figure 3. Compensatory Responses at the Level of the Mitochondrial ETC
RNAi dilution series for atp-3 (A), nuo-2 (B), and cco-1 (C and D) were established using wild-type (N2 [A–C]) or rrf-3(pk1426) mutant (D) animals (target gene to empty vector ratio: 0:1, 1:100, 1:50, 1:20, 1:10, 1:5, 1:2, and 1:0). Samples were grown until adulthood (except animals treated with undiluted atp-3 RNAi, which remained arrested as L3 larvae), then harvested as first-day adults. Levels of four mitochondrial proteins (ANT, NUO-2 [complex I], subunit I of complex IV, and the α-subunit of complex V) were measured in whole-worm extracts using western analysis. Untreated, wild-type animals cultured on OP50 E. coli were harvested as third or fourth stage larvae (L3 and L4, respectively) as well as first-day gravid adults (GA) and then similarly subjected to western analysis ([A], inset). Differences in sample loading within each experiment were normalized against actin. Each experiment was then further normalized against the respective vector-only treatment (or relative to GA in the case of OP50-fed N2). Data in each panel represent the mean (±SEM) of at least two independent experiments (except [D], which represents a single experiment).
Figure 4
Figure 4. Oxidative Stress Does Not Correlate with atp-3 Life Extension
(A) Whole-worm extracts were prepared from an atp-3 RNAi dilution series established in N2 exactly as described for Figure 3A (and including 1:1,000, 1:500, and 1:200 dilutions [atp-3 RNAi to empty vector]). Protein carbonylation was detected using DNP chemistry coupled with western analysis. Data are presented as the mean (± SEM) of replicate experiments from a dilution series sample set normalized to vector-only treatment (following Ponceau normalization to control for differences in sample loading). (B) N2 animals were exposed to either vector or skn-1 RNAi from the time of hatching. Levels of protein carbonylation in whole-worm, L1 extracts were detected using DNP chemistry coupled with western analysis (left panel). Samples were reprobed for 3-nitrotyrosine staining (middle panel). Equal protein loading was confirmed by Ponceau staining (right panel). A duplicate experiment showed identical results. (C) An RNAi dilution series against atp-3 was established in both wild-type (N2, black line) and mutant skn-1(zu67) (red line) animals (n = 80/condition). skn-1 animals were collected from 16,000 eggs as described in Materials and Methods.
Figure 5
Figure 5. A Larval Signal Triggers atp-3 Life Extension
(A) A synchronous population of N2 was exposed to an atp-3 RNAi dilution series either from the time of hatching (black line) or 3 d later after progression to 1-d-old gravid adulthood (red line). Life extension was evident only in animals exposed to atp-3 RNAi from the time of hatching. (B and C) A synchronous population of N2 was cultured on a standard OP50 bacterial lawn. Worms representing each stage of development, (larval stages L1 to L4, and young adults [YA]), were transferred to vector control or 1:10 atp-3 RNAi plates (n = 60/condition). The effect of atp-3 RNAi on adult lifespan (B) and final adult size (C) is shown. Lifespan data are normalized relative to the vector control for each larval stage. Normaski image in (C) is of 2-d-old adult worms (400×): bottom to top: egg, L1, L2, L3, L4, and YA on 1:10 atp-3 RNAi. The top animal was transferred to vector control as a YA. Scale bar indicates 100 μm.
Figure 6
Figure 6. Adult Size Decreases with Increasing Mit Mutant RNAi Concentration
RNAi dilution series for nuo-2, cyc-1, cco-1, isp-1, and R53.4 were established using N2 (left column), eri-1(mg366) (middle column), and rrf-3(pk1426) (right column) animals. When vector-only treated animals became 1-d-old gravid adults, individual worms were randomly selected from each RNAi dilution and mounted for Normaski imaging (400×): left to right (target gene to empty vector ratio), 0:1, 1:1,000, 1:750, 1:500, 1:200, 1:100, 1:50, 1:20, 1:10, 1:5, 1:2, and 1:0. Scale bars indicate 100 μm.
Figure 7
Figure 7. Egg Production Rate, Fecundity, and Fertility Decrease with Increasing atp-3 RNAi Concentration
An RNAi dilution series for atp-3 was established using N2. Egg production rate (A), and fecundity and fertility (B) were measured as described (Materials and Methods). Day 1 corresponds to the start of egg laying for each dilution. In (A), animals treated with 1:5, 1:2, and undiluted atp-3 RNAi failed to lay eggs and have been omitted.
Figure 8
Figure 8. Rate of Larval Development Decreases with Increasing atp-3 RNAi Concentration
N2 animals exposed to undiluted atp-3 RNAi (right panels) from the time of hatching were collected for Normaski imaging (1000×), 4 d later (worm #1) and 6 d later (worms #2–6) . Shown is the extent of vulval and gonadal development in selected individuals. For comparative purposes, N2 animals (left panels) were cultured on control bacteria and collected during various stages of their development. Scale bar applies to all panels, and indicates 25 μm.
Figure 9
Figure 9. Concordance of the Mit Phenotypes
Four phenotypes (top to bottom panels: mean larval developmental rate, mean lifespan, mean adult size, and mean fertility) were scored across an atp-3 RNAi dilution series. Data are derived from Figures 1 and 7 and Table S1 and is tabulated in a color-coded format (key). All four phenotypes become disrupted concordantly. At an RNAi dilution of 1:100 mean lifespan, mean adult size and mean fertility became recognizably different from vector-treated animals. By 1:50, mean larval development (assayed using a dissecting microscope and not high-power optics) became noticeably retarded. Larval development (top panel) was quantitated as follows: 30 freshly laid eggs were placed onto each of the indicated atp-3 RNAi dilutions (top row). At the listed times (left column), the stage of development of each hatchling was scored. An average developmental stage at each time interval was calculated by assigning each larval stage a number (shown in key) and then taking the average value for each 30-worm population.

Comment in

References

    1. Wallace DC. A mitochondrial paradigm of metabolic and degenerative diseases, aging, and cancer: a dawn for evolutionary medicine. Annu Rev Genet. 2005;39:359–407. - PMC - PubMed
    1. Campuzano V, Montermini L, Molto MD, Pianese L, Cossee M, et al. Friedreich's ataxia: Autosomal recessive disease caused by an intronic GAA triplet repeat expansion. Science. 1996;271:1423–1427. - PubMed
    1. Gerber J, Lill R. Biogenesis of iron-sulfur proteins in eukaryotes: Components, mechanism and pathology. Mitochondrion. 2002;2:71–86. - PubMed
    1. Karlberg T, Schagerlof U, Gakh O, Park S, Ryde U, et al. The structures of frataxin oligomers reveal the mechanism for the delivery and detoxification of iron. Structure. 2006;14:1535–1546. - PubMed
    1. Rea SL. Metabolism in the Caenorhabditis elegans Mit mutants. Exp Gerontol. 2005;40:841–849. - PubMed

Publication types