Gene expression profiling of long-lived dwarf mice: longevity-associated genes and relationships with diet, gender and aging
- PMID: 17915019
- PMCID: PMC2094713
- DOI: 10.1186/1471-2164-8-353
Gene expression profiling of long-lived dwarf mice: longevity-associated genes and relationships with diet, gender and aging
Abstract
Background: Long-lived strains of dwarf mice carry mutations that suppress growth hormone (GH) and insulin-like growth factor I (IGF-I) signaling. The downstream effects of these endocrine abnormalities, however, are not well understood and it is unclear how these processes interact with aging mechanisms. This study presents a comparative analysis of microarray experiments that have measured hepatic gene expression levels in long-lived strains carrying one of four mutations (Prop1(df/df), Pit1(dw/dw), Ghrhr(lit/lit), GHR-KO) and describes how the effects of these mutations relate to one another at the transcriptional level. Points of overlap with the effects of calorie restriction (CR), CR mimetic compounds, low fat diets, gender dimorphism and aging were also examined.
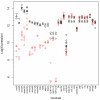
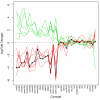
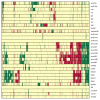
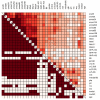
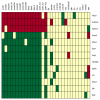
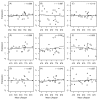
Results: All dwarf mutations had larger and more consistent effects on IGF-I expression than dietary treatments. In comparison to dwarf mutations, however, the transcriptional effects of CR (and some CR mimetics) overlapped more strongly with those of aging. Surprisingly, the Ghrhr(lit/lit) mutation had much larger effects on gene expression than the GHR-KO mutation, even though both mutations affect the same endocrine pathway. Several genes potentially regulated or co-regulated with the IGF-I transcript in liver tissue were identified, including a DNA repair gene (Snm1) that is upregulated in proportion to IGF-I inhibition. A total of 13 genes exhibiting parallel differential expression patterns among all four strains of long-lived dwarf mice were identified, in addition to 30 genes with matching differential expression patterns in multiple long-lived dwarf strains and under CR.
Conclusion: Comparative analysis of microarray datasets can identify patterns and consistencies not discernable from any one dataset individually. This study implements new analytical approaches to provide a detailed comparison among the effects of life-extending mutations, dietary treatments, gender and aging. This comparison provides insight into a broad range of issues relevant to the study of mammalian aging. In this context, 43 longevity-associated genes are identified and individual genes with the highest level of support among all microarray experiments are highlighted. These results provide promising targets for future experimental investigation as well as potential clues for understanding the functional basis of lifespan extension in mammalian systems.
Figures



Similar articles
-
Gender-specific alterations in gene expression and loss of liver sexual dimorphism in the long-lived Ames dwarf mice.Biochem Biophys Res Commun. 2005 Jul 15;332(4):1086-100. doi: 10.1016/j.bbrc.2005.05.063. Biochem Biophys Res Commun. 2005. PMID: 15925325
-
Endocrine regulation of heat shock protein mRNA levels in long-lived dwarf mice.Mech Ageing Dev. 2009 Jun;130(6):393-400. doi: 10.1016/j.mad.2009.03.004. Epub 2009 Apr 8. Mech Ageing Dev. 2009. PMID: 19428459 Free PMC article.
-
Hepatic gene and protein expression of primary components of the IGF-I axis in long lived Snell dwarf mice.Mech Ageing Dev. 2005 Jun-Jul;126(6-7):692-704. doi: 10.1016/j.mad.2005.01.002. Mech Ageing Dev. 2005. PMID: 15888324
-
THow diet interacts with longevity genes.Hormones (Athens). 2008 Jan-Mar;7(1):17-23. doi: 10.14310/horm.2002.1111033. Hormones (Athens). 2008. PMID: 18359740 Review.
-
Altered structure and function of adipose tissue in long-lived mice with growth hormone-related mutations.Adipocyte. 2017 Apr 3;6(2):69-75. doi: 10.1080/21623945.2017.1308990. Epub 2017 Mar 21. Adipocyte. 2017. PMID: 28425851 Free PMC article. Review.
Cited by
-
Life spanning murine gene expression profiles in relation to chronological and pathological aging in multiple organs.Aging Cell. 2013 Oct;12(5):901-909. doi: 10.1111/acel.12118. Epub 2013 Jul 14. Aging Cell. 2013. PMID: 23795901 Free PMC article.
-
Activation of genes involved in xenobiotic metabolism is a shared signature of mouse models with extended lifespan.Am J Physiol Endocrinol Metab. 2012 Aug 15;303(4):E488-95. doi: 10.1152/ajpendo.00110.2012. Epub 2012 Jun 12. Am J Physiol Endocrinol Metab. 2012. PMID: 22693205 Free PMC article.
-
Genetic studies reveal the role of the endocrine and metabolic systems in aging.J Clin Endocrinol Metab. 2010 Oct;95(10):4493-500. doi: 10.1210/jc.2010-0859. J Clin Endocrinol Metab. 2010. PMID: 20926537 Free PMC article. Review.
-
How Far Are We from Prescribing Fasting as Anticancer Medicine?Int J Mol Sci. 2020 Dec 1;21(23):9175. doi: 10.3390/ijms21239175. Int J Mol Sci. 2020. PMID: 33271979 Free PMC article. Review.
-
The IGF System and Aging.Endocr Rev. 2025 Mar 11;46(2):214-223. doi: 10.1210/endrev/bnae029. Endocr Rev. 2025. PMID: 39418083 Free PMC article. Review.
References
-
- Silberberg R. Articular aging and osteroarthritis in dwarf mice. Pathol Microbiol (Basel) 1972;38:417–430. - PubMed
-
- Ikeno Y, Bronson RT, Hubbard GB, Lee S, Bartke A. Delayed occurrence of fatal neoplastic diseases in Ames dwarf mice: correlation to extended longevity. J Gerontology. 2003;58A:291–296. - PubMed
Publication types
MeSH terms
Substances
Grants and funding
LinkOut - more resources
Full Text Sources
Medical
Research Materials
Miscellaneous

