

The role of transmural ventricular heterogeneities in cardiac vulnerability to electric shocks
- PMID: 17915299
- PMCID: PMC2821334
- DOI: 10.1016/j.pbiomolbio.2007.07.017
The role of transmural ventricular heterogeneities in cardiac vulnerability to electric shocks
Abstract
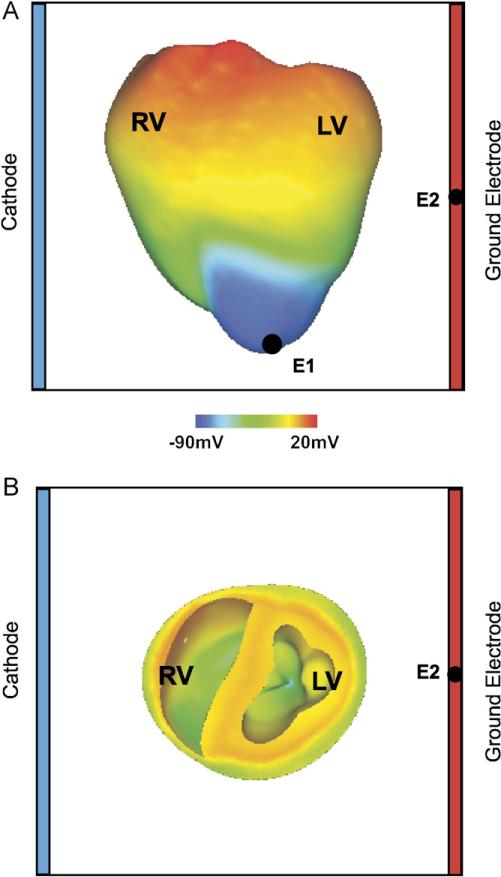
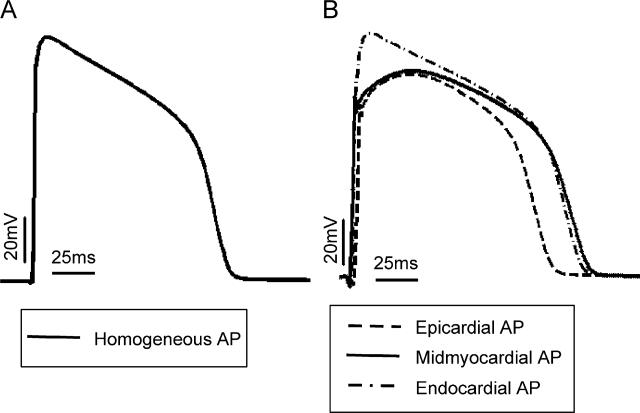
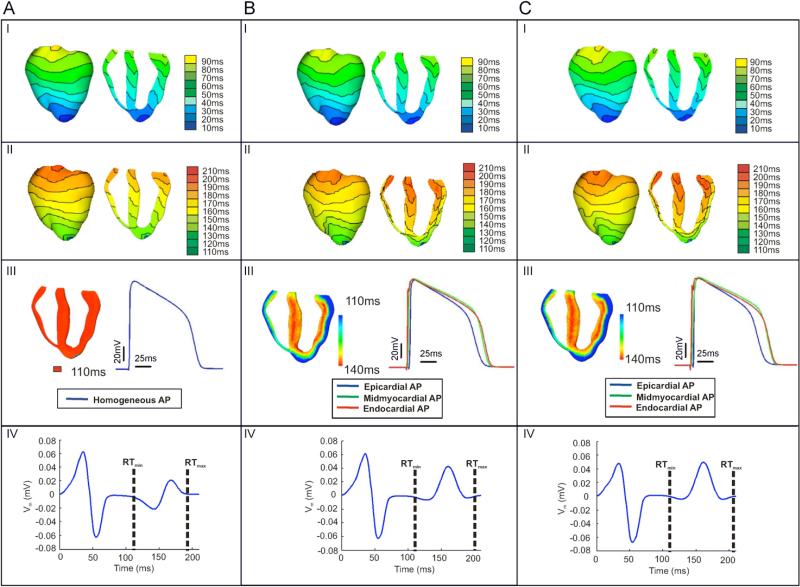
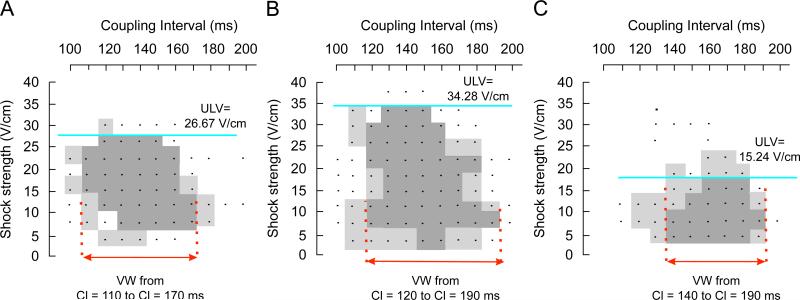
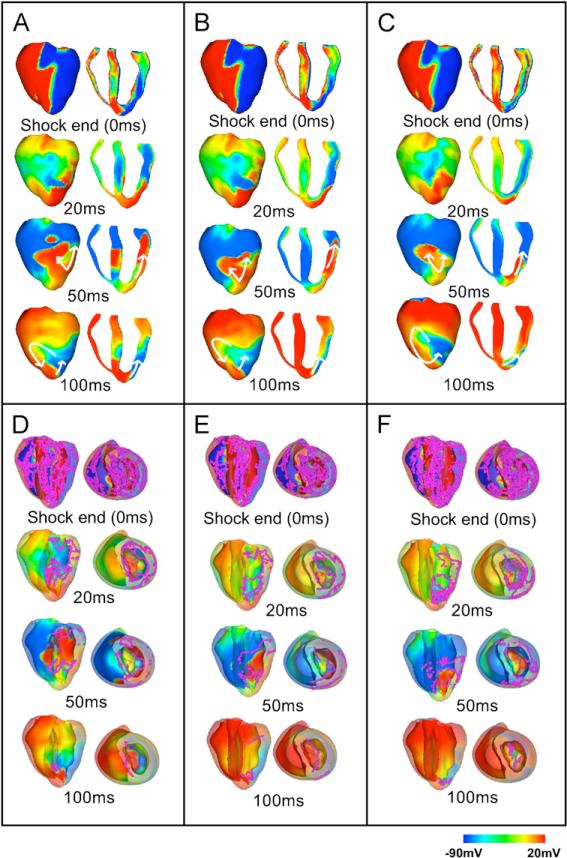
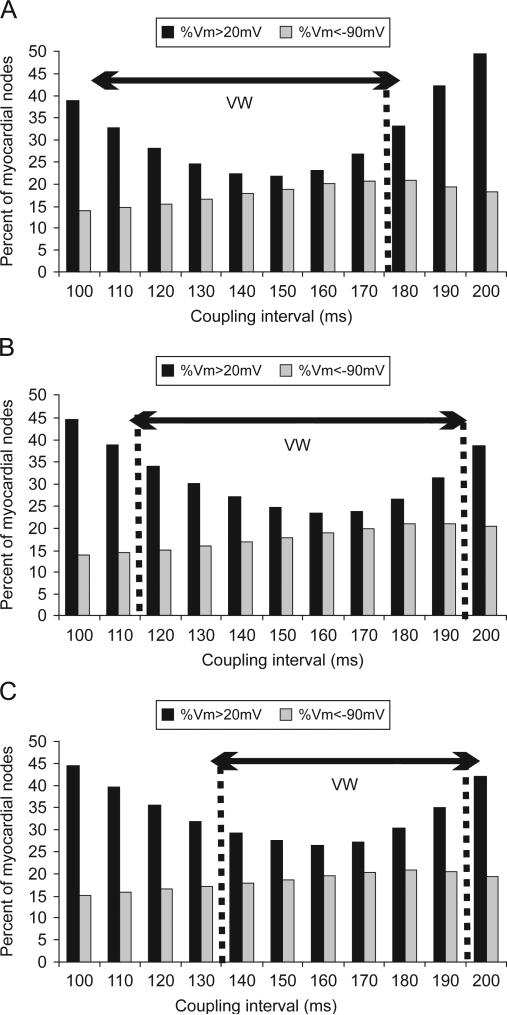
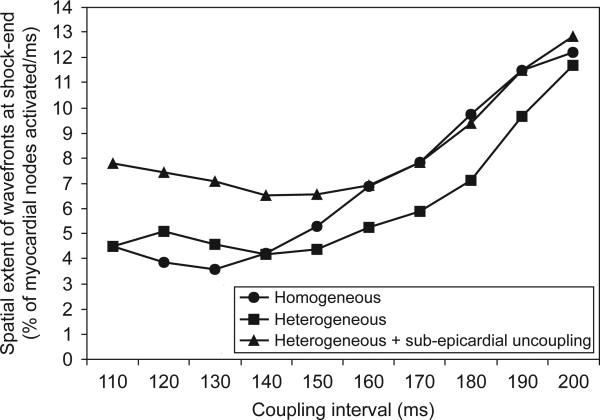
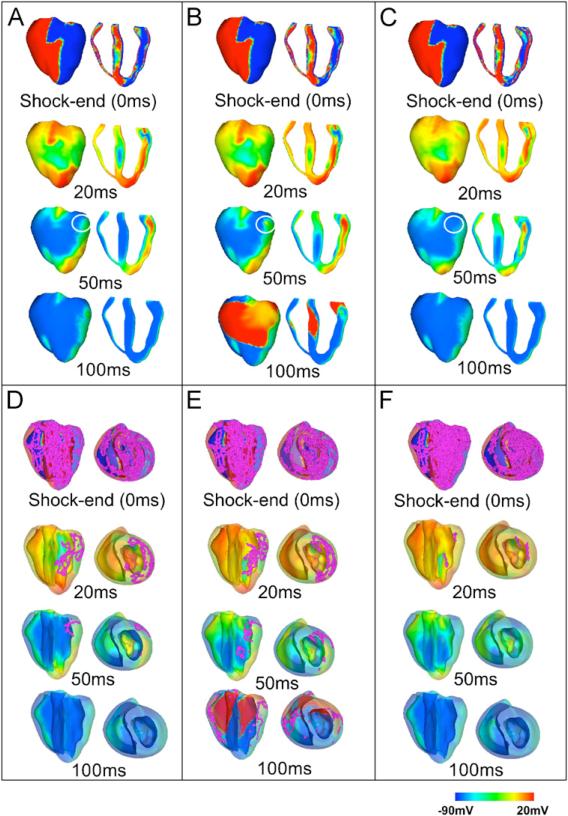
Transmural electrophysiological heterogeneities have been shown to contribute to arrhythmia induction in the heart; however, their role in defibrillation failure has never been examined. The goal of this study is to investigate how transmural heterogeneities in ionic currents and gap-junctional coupling contribute to arrhythmia generation following defibrillation strength shocks. This study used a 3D anatomically realistic bidomain model of the rabbit ventricles. Transmural heterogeneity in ionic currents and reduced sub-epicardial intercellular coupling were incorporated based on experimental data. The ventricles were paced apically, and truncated-exponential monophasic shocks of varying strength and timing were applied via large external electrodes. Simulations demonstrate that inclusion of transmural heterogeneity in ionic currents results in an increase in vulnerability to shocks, reflected in the increased upper limit of vulnerability, ULV, and the enlarged vulnerable window, VW. These changes in vulnerability stem from increased post-shock dispersion in repolarisation as it increases the likelihood of establishment of re-entrant circuits. In contrast, reduced sub-epicardial coupling results in decrease in both ULV and VW. This decrease is caused by altered virtual electrode polarisation around the region of sub-epicardal uncoupling, and specifically, by the increase in (1) the amount of positively polarised myocardium at shock-end and (2) the spatial extent of post-shock wavefronts.
Figures
Similar articles
-
Transmural electrophysiological heterogeneities in action potential duration increase the upper limit of vulnerability.Conf Proc IEEE Eng Med Biol Soc. 2006;2006:4043-6. doi: 10.1109/IEMBS.2006.259345. Conf Proc IEEE Eng Med Biol Soc. 2006. PMID: 17946217
-
Vulnerability to electric shocks in the regionally-ischemic ventricles.Conf Proc IEEE Eng Med Biol Soc. 2006;2006:2280-3. doi: 10.1109/IEMBS.2006.259919. Conf Proc IEEE Eng Med Biol Soc. 2006. PMID: 17946101
-
Cardiac vulnerability to electric shocks during phase 1A of acute global ischemia.Heart Rhythm. 2004 Dec;1(6):695-703. doi: 10.1016/j.hrthm.2004.08.018. Heart Rhythm. 2004. PMID: 15851241
-
Defibrillation of the heart: insights into mechanisms from modelling studies.Exp Physiol. 2006 Mar;91(2):323-37. doi: 10.1113/expphysiol.2005.030973. Epub 2006 Feb 9. Exp Physiol. 2006. PMID: 16469820 Review.
-
Progressive depolarization: a unified hypothesis for defibrillation and fibrillation induction by shocks.J Cardiovasc Electrophysiol. 1998 May;9(5):529-52. doi: 10.1111/j.1540-8167.1998.tb01847.x. J Cardiovasc Electrophysiol. 1998. PMID: 9607463 Review.
Cited by
-
New insights into defibrillation of the heart from realistic simulation studies.Europace. 2014 May;16(5):705-13. doi: 10.1093/europace/eut330. Europace. 2014. PMID: 24798960 Free PMC article. Review.
-
Unstable QT interval dynamics precedes ventricular tachycardia onset in patients with acute myocardial infarction: a novel approach to detect instability in QT interval dynamics from clinical ECG.Circ Arrhythm Electrophysiol. 2011 Dec;4(6):858-66. doi: 10.1161/CIRCEP.110.961763. Epub 2011 Aug 14. Circ Arrhythm Electrophysiol. 2011. PMID: 21841208 Free PMC article.
-
The functional role of electrophysiological heterogeneity in the rabbit ventricle during rapid pacing and arrhythmias.Am J Physiol Heart Circ Physiol. 2013 May;304(9):H1240-52. doi: 10.1152/ajpheart.00894.2012. Epub 2013 Feb 22. Am J Physiol Heart Circ Physiol. 2013. PMID: 23436328 Free PMC article.
-
Computational rabbit models to investigate the initiation, perpetuation, and termination of ventricular arrhythmia.Prog Biophys Mol Biol. 2016 Jul;121(2):185-94. doi: 10.1016/j.pbiomolbio.2016.06.004. Epub 2016 Jun 19. Prog Biophys Mol Biol. 2016. PMID: 27334789 Free PMC article. Review.
References
-
- Aguel F, Eason J, Trayanova N. Advances in modeling cardiac defibrillation. Int. J. Bifurcations Chaos. 2003;13:3791–3805.
-
- Antzelevitch C, Fish J. Electrical heterogeneity within the ventricular wall. Basic Res. Cardiol. 2001;96:517–527. - PubMed
-
- Antzelevitch C, Shimizu W, Yan GX, Sicouri S, Weissenburger J, Nesterenko VV, Burashnikov A, di Diego J, Saffitz J, Thomas GP. The M cell: its contribution to the ECG and to normal and abnormal electrical function of the heart. J. Cardiovasc. Electrophysiol. 1999a;10(8):1124–1152. - PubMed
-
- Antzelevitch C, Yan GX, Shimizu W, Burashnikov A. Electrical heterogeneity, the ECG, and cardiac arrhythmias. In: Zipes DP, Jalife J, editors. Cardiac Electrophysiology: From Cell to Bedside. W.B. Saunders Co.; Philadelphia: 1999b. pp. 222–228.
-
- Anyukhovsky EP, Sosunov EA, Rosen MR. Regional differences in electrophysiological properties of epicardium, midmyocardium, and endocardium, in vitro and in vivo correlations. Circulation. 1996;94:1981–1988. - PubMed
Publication types
MeSH terms
Grants and funding
LinkOut - more resources
Full Text Sources
Other Literature Sources
Miscellaneous
