

Functional and evolutionary analysis of alternatively spliced genes is consistent with an early eukaryotic origin of alternative splicing
- PMID: 17916237
- PMCID: PMC2082043
- DOI: 10.1186/1471-2148-7-188
Functional and evolutionary analysis of alternatively spliced genes is consistent with an early eukaryotic origin of alternative splicing
Abstract
Background: Alternative splicing has been reported in various eukaryotic groups including plants, apicomplexans, diatoms, amoebae, animals and fungi. However, whether widespread alternative splicing has evolved independently in the different eukaryotic groups or was inherited from their last common ancestor, and may therefore predate multicellularity, is still unknown. To better understand the origin and evolution of alternative splicing and its usage in diverse organisms, we studied alternative splicing in 12 eukaryotic species, comparing rates of alternative splicing across genes of different functional classes, cellular locations, intron/exon structures and evolutionary origins.
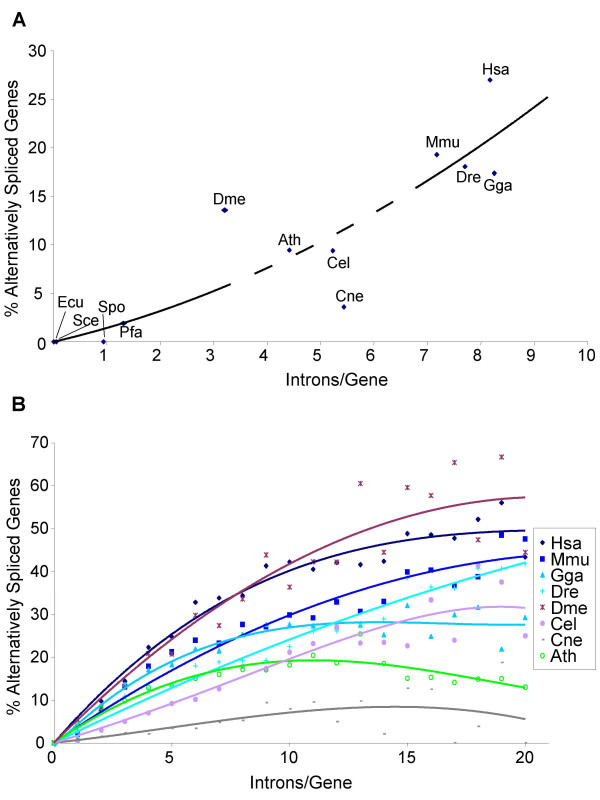
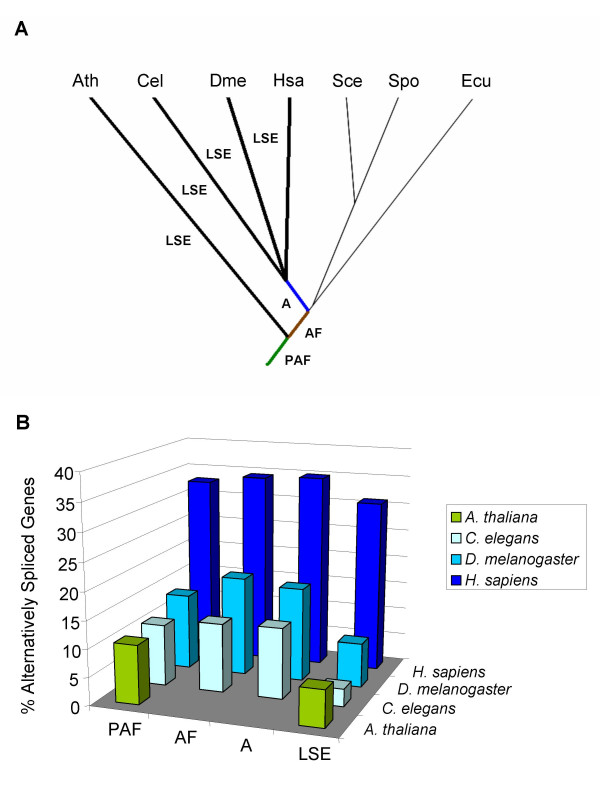
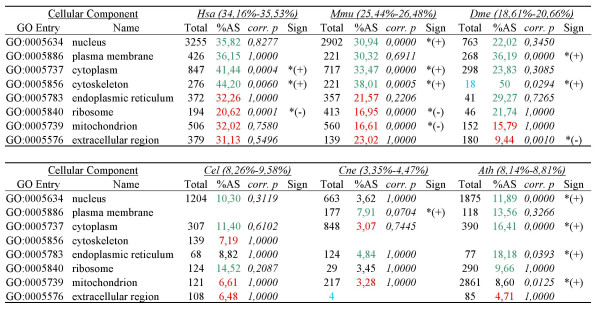
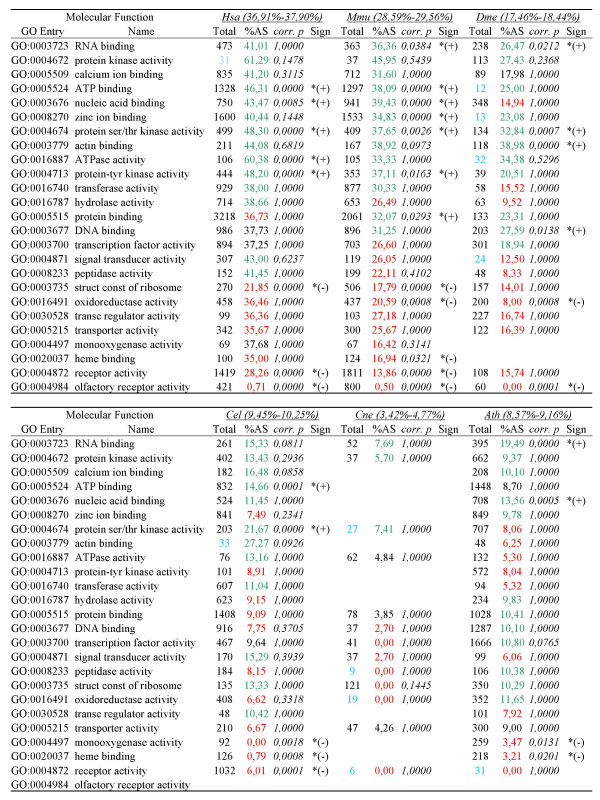
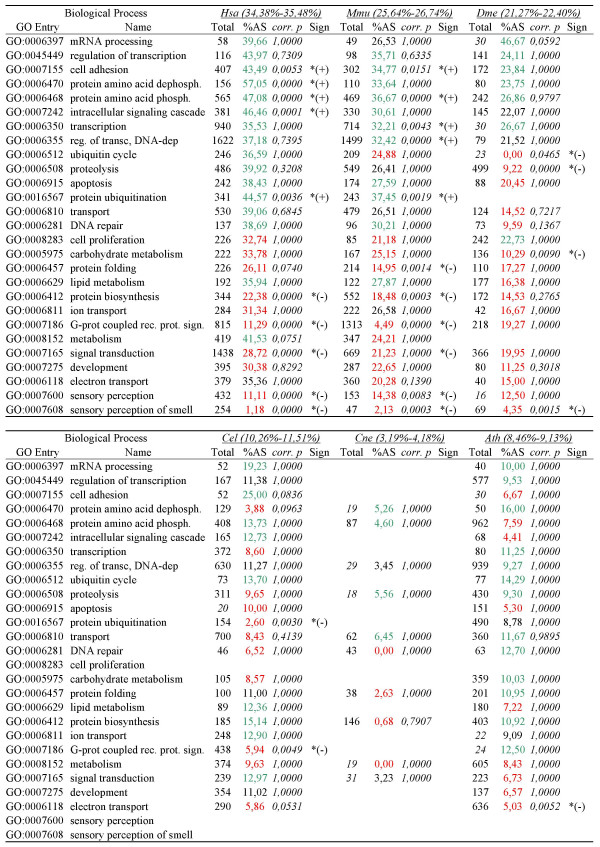
Results: For each species, we find that genes from most functional categories are alternatively spliced. Ancient genes (shared between animals, fungi and plants) show high levels of alternative splicing. Genes with products expressed in the nucleus or plasma membrane are generally more alternatively spliced while those expressed in extracellular location show less alternative splicing. We find a clear correspondence between incidence of alternative splicing and intron number per gene both within and between genomes. In general, we find several similarities in patterns of alternative splicing across these diverse eukaryotes.
Conclusion: Along with previous studies indicating intron-rich genes with weak intron boundary consensus and complex spliceosomes in ancestral organisms, our results suggest that at least a simple form of alternative splicing may already have been present in the unicellular ancestor of plants, fungi and animals. A role for alternative splicing in the evolution of multicellularity then would largely have arisen by co-opting the preexisting process.
Figures
Similar articles
-
Origin and evolution of spliceosomal introns.Biol Direct. 2012 Apr 16;7:11. doi: 10.1186/1745-6150-7-11. Biol Direct. 2012. PMID: 22507701 Free PMC article. Review.
-
Evolutionary convergence on highly-conserved 3' intron structures in intron-poor eukaryotes and insights into the ancestral eukaryotic genome.PLoS Genet. 2008 Aug 8;4(8):e1000148. doi: 10.1371/journal.pgen.1000148. PLoS Genet. 2008. PMID: 18688272 Free PMC article.
-
Whence genes in pieces: reconstruction of the exon-intron gene structures of the last eukaryotic common ancestor and other ancestral eukaryotes.Wiley Interdiscip Rev RNA. 2013 Jan-Feb;4(1):93-105. doi: 10.1002/wrna.1143. Epub 2012 Nov 8. Wiley Interdiscip Rev RNA. 2013. PMID: 23139082 Review.
-
Splicing in the eukaryotic ancestor: form, function and dysfunction.Trends Ecol Evol. 2009 Aug;24(8):447-55. doi: 10.1016/j.tree.2009.04.005. Epub 2009 Jul 1. Trends Ecol Evol. 2009. PMID: 19576657
-
Systematic analysis of intron size and abundance parameters in diverse lineages.Sci China Life Sci. 2013 Oct;56(10):968-74. doi: 10.1007/s11427-013-4540-y. Sci China Life Sci. 2013. PMID: 24022126
Cited by
-
Fungal alternative splicing is associated with multicellular complexity and virulence: a genome-wide multi-species study.DNA Res. 2014 Feb;21(1):27-39. doi: 10.1093/dnares/dst038. Epub 2013 Oct 11. DNA Res. 2014. PMID: 24122896 Free PMC article.
-
On the Function of Trans-Splicing: No Evidence for Widespread Proteome Diversification in Trypanosomes.Genome Biol Evol. 2019 Oct 1;11(10):3014-3021. doi: 10.1093/gbe/evz217. Genome Biol Evol. 2019. PMID: 31599940 Free PMC article.
-
Identification of Alternative Variants and Insertion of the Novel Polymorphic AluYl17 in TSEN54 Gene during Primate Evolution.Int J Genomics. 2016;2016:1679574. doi: 10.1155/2016/1679574. Epub 2016 Dec 19. Int J Genomics. 2016. PMID: 28083540 Free PMC article.
-
Lariat sequencing in a unicellular yeast identifies regulated alternative splicing of exons that are evolutionarily conserved with humans.Proc Natl Acad Sci U S A. 2013 Jul 30;110(31):12762-7. doi: 10.1073/pnas.1218353110. Epub 2013 Jul 16. Proc Natl Acad Sci U S A. 2013. PMID: 23861491 Free PMC article.
-
Origin and evolution of spliceosomal introns.Biol Direct. 2012 Apr 16;7:11. doi: 10.1186/1745-6150-7-11. Biol Direct. 2012. PMID: 22507701 Free PMC article. Review.
References
-
- Loftus BJ, Fung E, Roncaglia P, Rowley D, Amedeo P, Bruno D, Vamathevan J, Miranda M, Anderson IJ, Fraser JA, Allen JE, Bosdet IE, Brent MR, Chiu R, Doering TL, Donlin MJ, D'Souza CA, Fox DS, Grinberg V, Fu J, Fukushima M, Haas BJ, Huang JC, Janbon G, Jones SJM, Koo HL, Krzywinski MI, Kwon-Chung JK, Lengeler KB, Maiti R, Marra MA, Marra RE, Mathewson CA, Mitchell TG, Pertea M, Riggs FR, Salzberg SL, Schein JE, Shvartsbeyn A, Shin H, Shumway M, Specht CA, Suh BB, Tenney A, Utterback TR, Wickes BL, Wortman JR, Wye NH, Kronstad JW, Lodge JK, Heitman J, Davis RW, Fraser CM, Hyman RW. The genome of the Basidiomycetous yeast and human pathogen Cryptococcus neoformans. Science. 2005;307:1321–1324. doi: 10.1126/science.1103773. - DOI - PMC - PubMed
-
- Li L, Brunk BP, Kissinger JC, Pape D, Tang K, Cole RH, Martin J, Wylie T, Dante M, Fogarty SJ, Howe DK, Liberator P, Diaz C, Anderson J, White M, Jerome ME, Johnson EA, Radke JA, Stoeckert CJ, Jr., Waterston RH, Clifton SW, Roos DS, Sibley LD. Gene discovery in the Apicomplexa as revealed by EST sequencing and assembly of a comparative gene database. Genome Res. 2003;13:443–454. doi: 10.1101/gr.693203. - DOI - PMC - PubMed
-
- Kinoshita S, Kaneko G, Lee JH, Kikuchi K, Yamada H, Hara T, Itoh Y, Watabe S. A novel heat stress-responsive gene in the marine diatom Chaetoceros compressum encoding two types of transcripts, a trypsin-like protease and its related protein, by alternative RNA splicing. Eur J Biochem. 2001;268:4599–4609. doi: 10.1046/j.1432-1327.2001.02360.x. - DOI - PubMed
Publication types
MeSH terms
LinkOut - more resources
Full Text Sources
Medical
